Reporting & Analysis
Apr 20, 2023
TLDR
E-commerce category managers can effectively analyze their product sales performance using Looker Studio templates powered by Airboxr for automatic updates. The process involves setting up a Google spreadsheet linked to Looker Studio and utilizing Airboxr Hops for data queries, including Product Sales Performance over Time, Vendor Sales Performance over Time, and Variant Sales over Time. Dashboards in Looker Studio can be customized to view various product sales trends, such as individual products, variant sales, and vendor sales. Airboxr provides templates and offers custom Looker templates upon request for users looking to streamline their sales analysis.
Which of my store’s products are moving the fastest? Which of my product discounts are most effective, and which are the most returned products that I may want to reconsider selling? These are some of the questions a category manager in an e-commerce store might think about on a regular basis.
In order to make decisions on what products to stock, which products to promote more aggressively, and so on, category managers need to have a solid understanding of how their products are selling, by product, variant, and vendor. They also need to be able to view sales trends over time, so as to understand the impact of marketing efforts.
Today, we’re giving e-commerce category managers the ability to get an overview of their product sales performance—using our Looker Studio templates. We’ll show you how we created a template on Looker, powered by Airboxr so it updates automatically. At the end, you can request the template for yourself, or speak to us if you want a template custom made for you.

Before we begin, you may have already seen our article on how to create reports in Google Looker Studio that update automatically. If you’re not yet familiar with Looker Studio, do read that article for a much more detailed walkthrough to help you get started.
Step 1: Set up your Google spreadsheet
Looker Studio has a native connection with Google Sheets, so the easiest way to get your data into Looker is by putting it into a spreadsheet and linking the two. Read more about how to connect your Google Sheet to Looker Studio.
For our example, we will set up our spreadsheet using Airboxr Hops. Hops are automated queries into your store data.
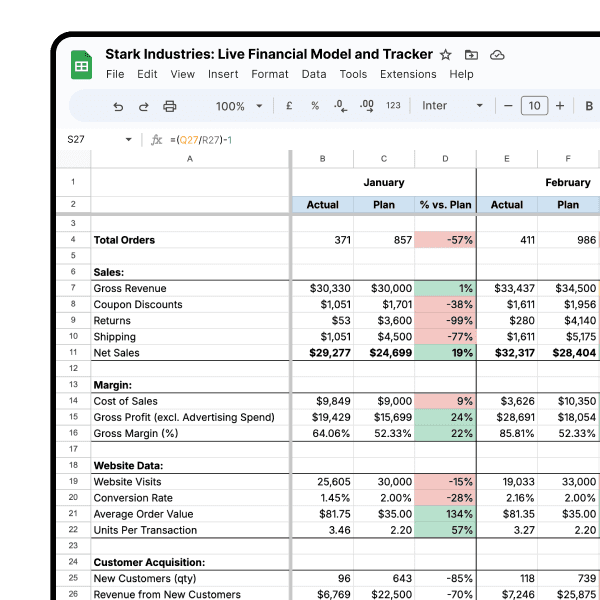
This is how our prepared spreadsheet will look like:

Which Hops do I use to set up my product sales performance dashboard?
As you can see, this dashboard is powered by three Hops, namely:
Find them all in the Hops Marketplace.
What timeframe should I run the Hops for?
If you tend to review product sales by quarter, then run it for the relevant dates in the quarter (e.g. for a Q1 2023 report, select a custom date range from 1 Jan 2023 to 31 Mar 2023).
If you’re more interested in viewing product sales according to a specific marketing campaign, run it for the dates of the campaign.
Run each Hop on a separate sheet. This will pull all your data into different worksheets in your Google spreadsheet.
Step 2: Set up your Looker Studio sales dashboard
Now that we have our Google spreadsheet ready, we can create a Looker report and link it to our spreadsheet. Remember to add each separate worksheet as a new data source, so that you will have all the data in your Looker report.
Once all the data sources are connected, you’re good to go. You can start adding charts and graphs as you please, depending on what metrics you want to see.
What are some examples of product sales performance reports I can make on Looker?
Here are some dashboards we created that you can take inspiration from.
Product Sales Trends
This is great for if you’re looking at individual products. Use the drop-down selector to filter the items by product title.

Variant Sales Trends
This is for if you need to view product sales by different sizes, colors, or other variations. Use the drop-down selector to filter the items by variant type.

Improve your DTC game. Sign up for weekly tips.
Vendor Sales Trends
This is great for if you sell items from different brands or categories. Use the drop-down selector to filter the items by product vendor.

I updated my spreadsheet. How do I refresh the data in my Looker report?
Easy—click on the three dots menu button on the top right hand corner of your Looker report, and select Refresh data.
Can I get your template and use it for myself?
Absolutely! We’d love to know who we’re helping, so write to us and we’ll email you a copy.
How do I get a Looker template custom made just for me?
We’re more than happy to help out our Airboxr users. Once you’ve logged in, simply ping us on the in-app chat and request for a template to be built for you.


