Growth Strategies
23.09.2022
TLDR
During peak sales seasons like Black Friday and Cyber Monday, tracking key metrics is crucial. These metrics fall into three main categories: revenue, performance marketing, and shipping/operations. For revenue, track daily sales, customers, average order value, sessions, and the Marketing Efficiency Ratio (MER). MER helps assess overall ad spend effectiveness. Performance marketers need daily campaign and keyword performance data. Shipping and operations require monitoring active inventory, shipping speed, and delivery performance. Automated reports and dashboards can streamline this process, providing real-time insights for informed decisions during hectic sales periods.
Peak sales season is the time of year where many businesses make the majority of their revenue. Spending activity is boosted due to significant events in a particular market, such as Christmas, Black Friday and Cyber Monday, year end sales, or other shopping holidays.
You probably know these periods as fast-paced and high stress work periods—because sales are accelerated, and you’ll want to track your sales on a daily, if not hourly basis. If you’re in marketing, you’ll want to know how well your campaigns are converting every day. If you’re in operations, you’ll need to keep track of whether shipments are being sent out on time, plus you have to make sure you won’t run out of stocks before sale period ends. And if you’re working in a small company, or are a business owner… you may be looking at all of these at once.

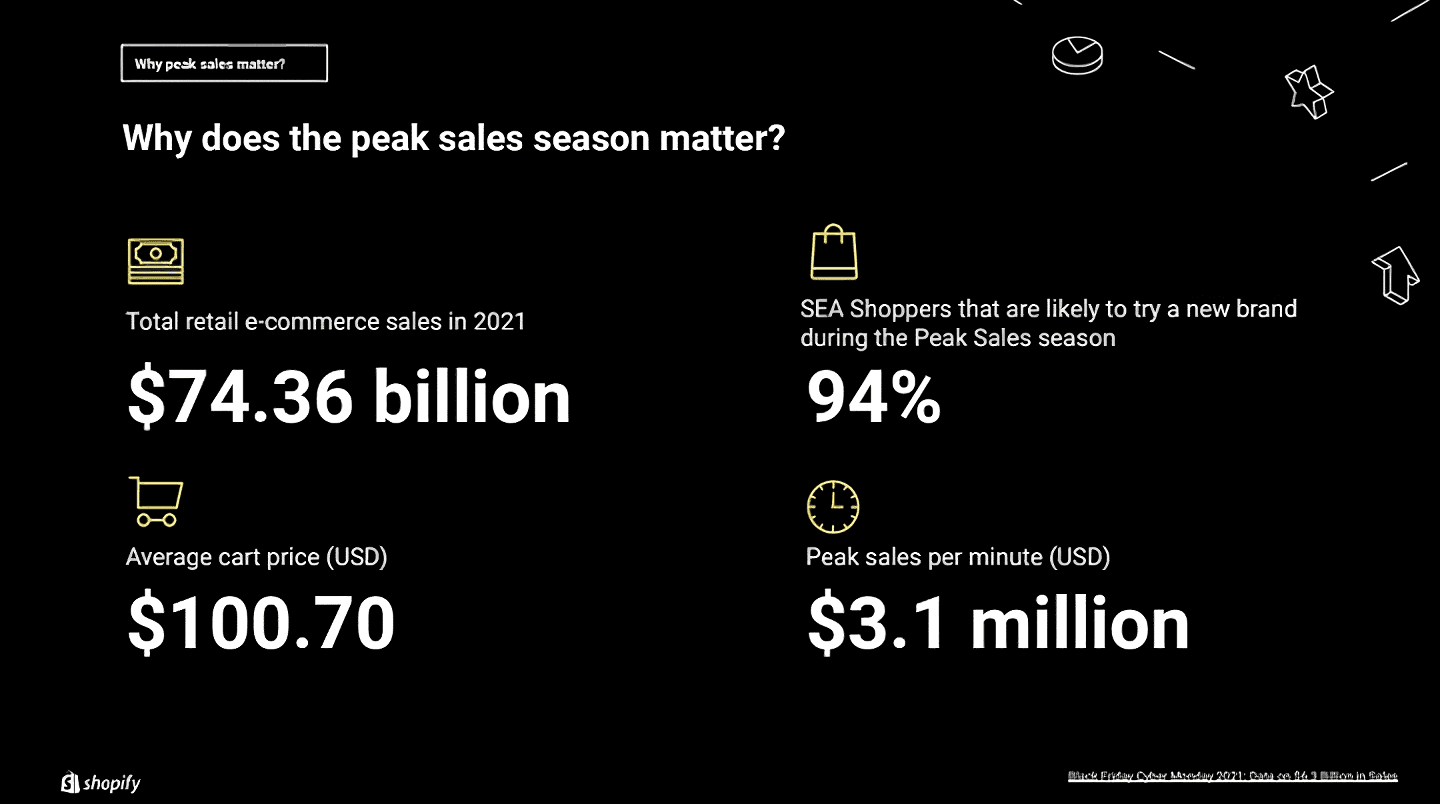
Peak sales season is a big deal that you want to be well prepared for. According to Shopify’s 2022 report, US$3.1 million worth of sales are made per minute during peak sales season. The average cart price is US$100.70.

As a D2C brand, what are the most important metrics to track during peak sales season? Glad you asked. We’ll look at the three main areas to focus on:
Your revenue metrics dashboard
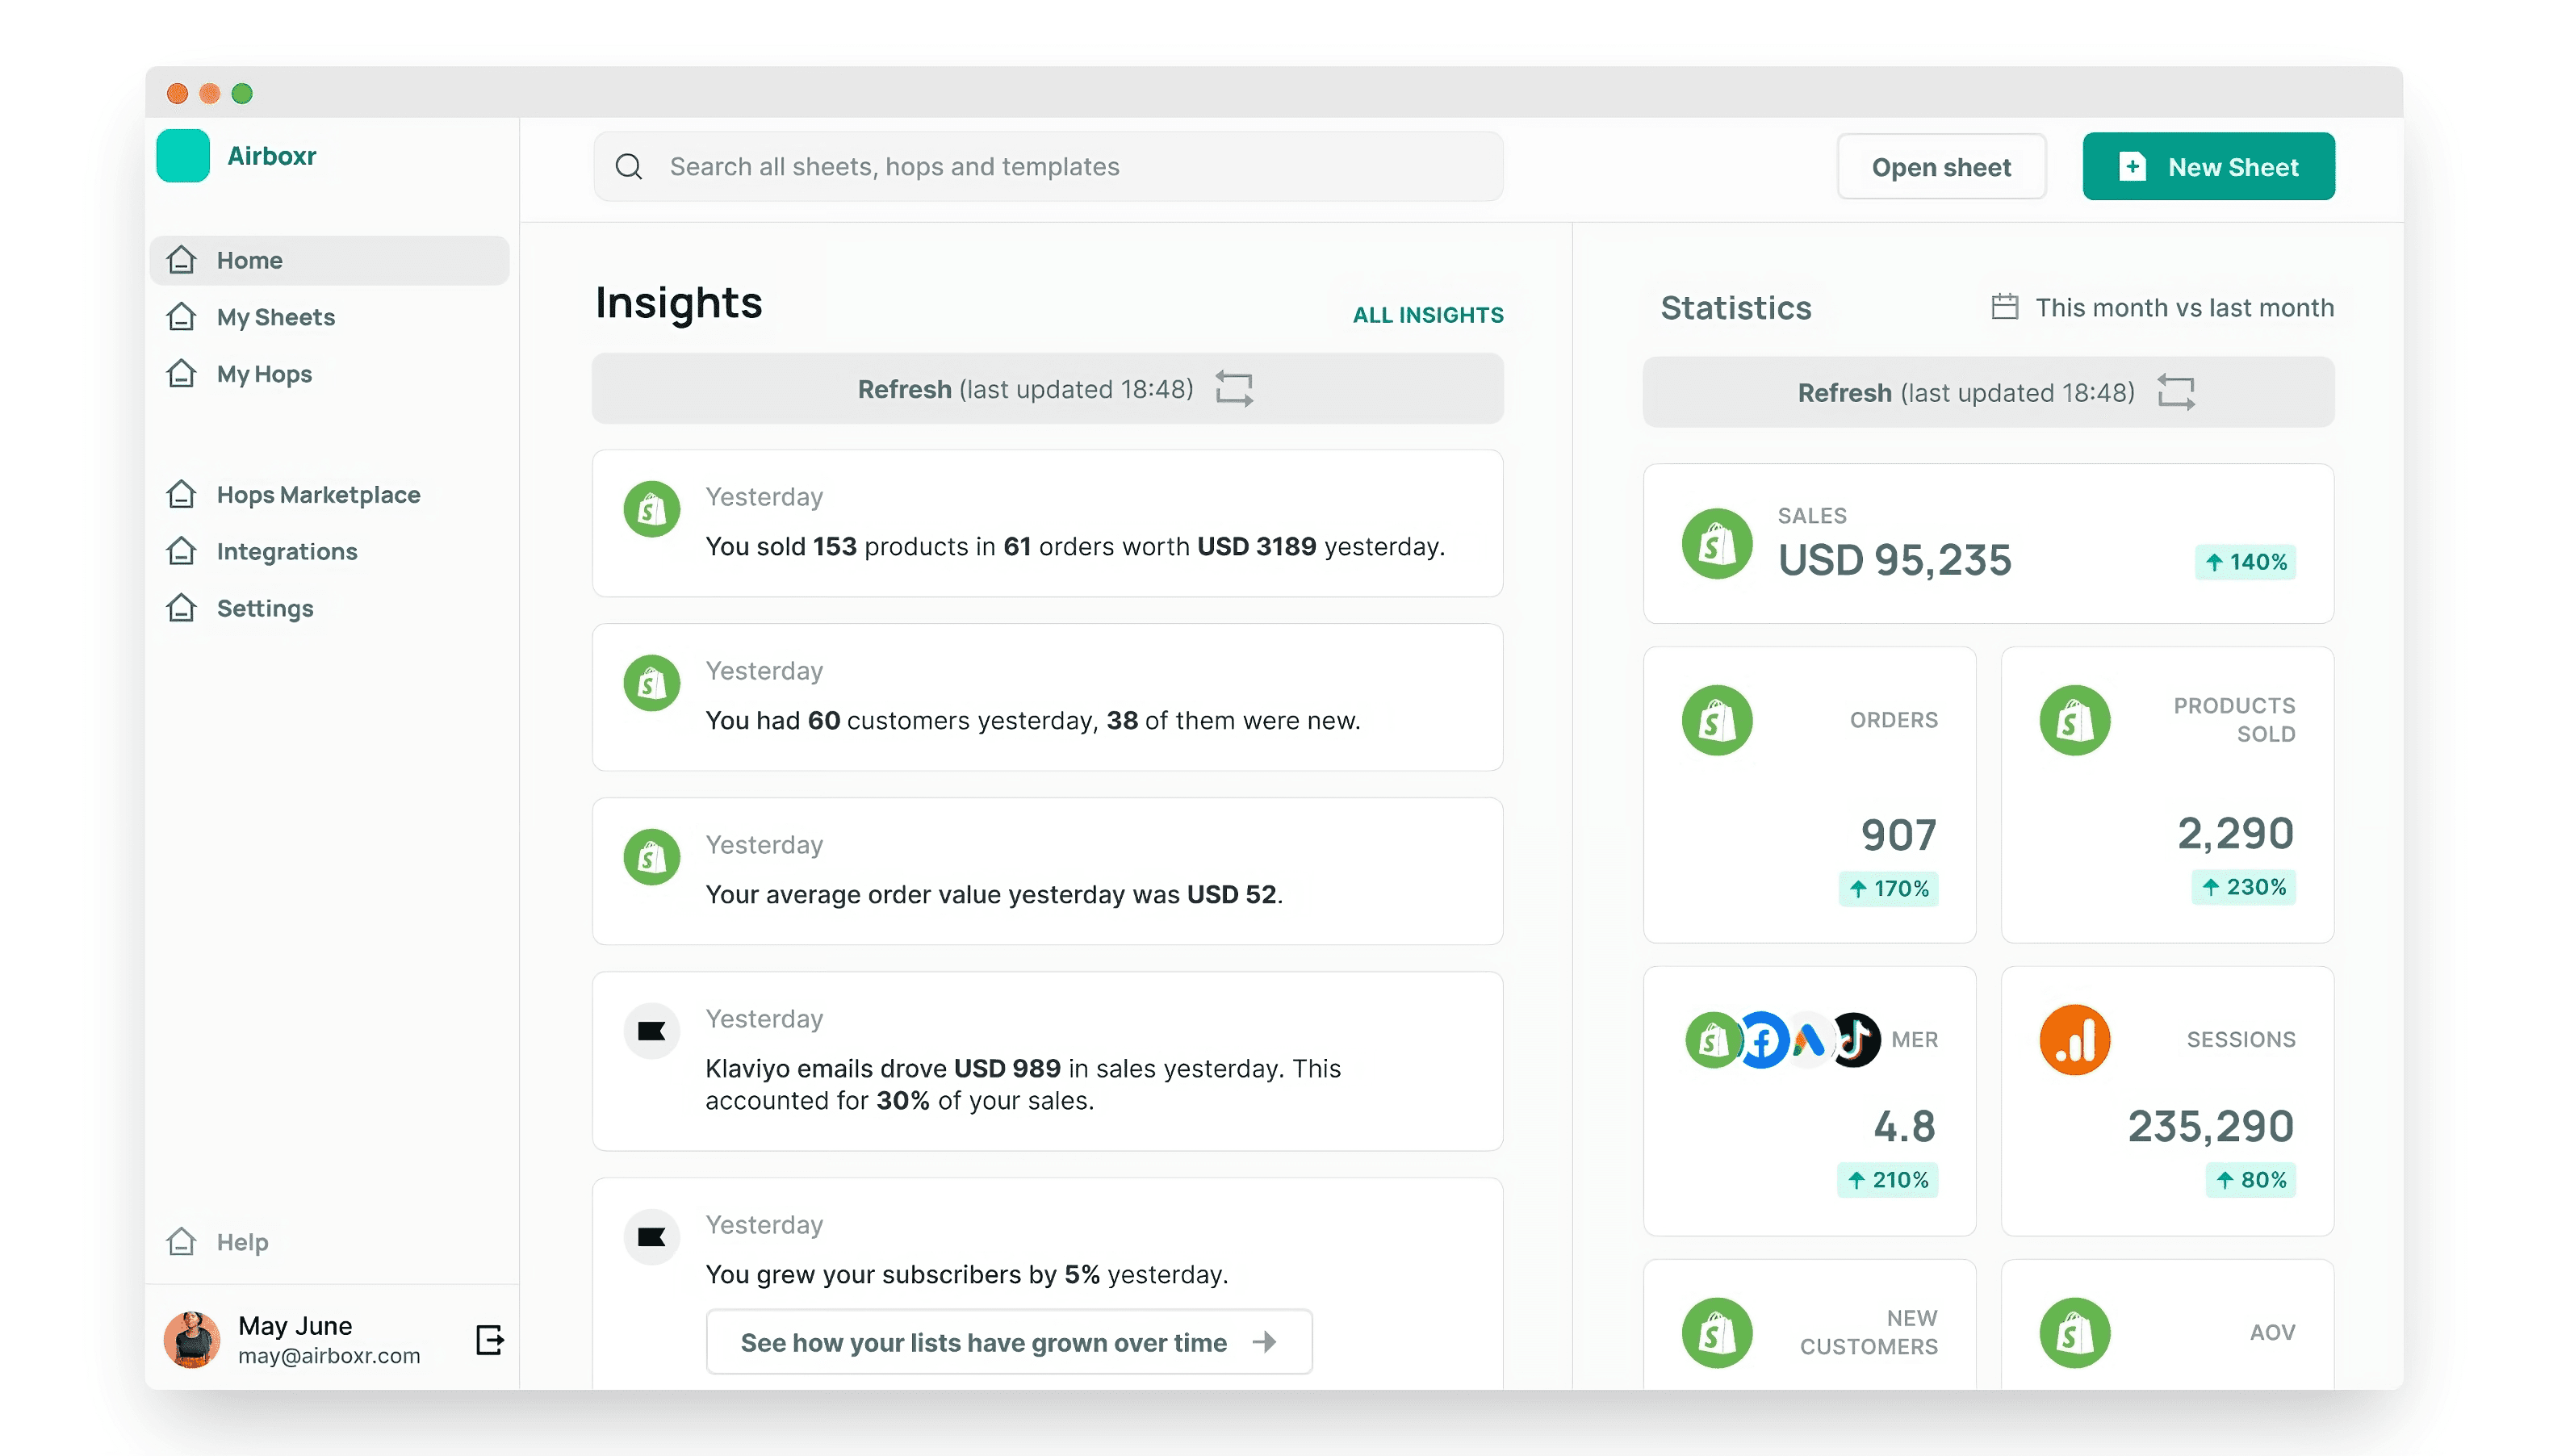
When sales are moving fast, the last thing you want is to have to scramble for data. That’s why you need an easy to view dashboard with all the core metrics relating to your store’s revenue. You can use Airboxr’s ready dashboard, or create your own using Google Data Studio.
Also read: How to present Airboxr reports within Google Data Studio

Revenue metrics to track
The most important revenue metrics to track during peak sales season are:
Daily sales (no. of products, no. of orders, revenue)
Daily customers (no. of customers, no. of new customers)
Daily average order value
Daily sessions to your website
Marketing Efficiency Ratio (total ad spend vs. total sales)
Having an overview of your sales and marketing performance is the most important hack for a business owner or a marketing director. At one glance, you can keep track of your daily sales and marketing metrics, to determine if your top line metrics are healthy or if you need to tweak your marketing budget on the fly.
💡 Why Marketing Efficiency Ratio (MER)?
As an overview, it makes more sense to assess your overall ad spend to your total sales, rather than compare the effectiveness of individual campaigns. There are several reasons for this:
Omnichannel marketing efforts. D2C brands rarely only spend on one ad channel. Between Google Ads, Facebook Ads, and even social selling channels like Instagram Shopping and TikTok Shopping, there are plenty of channels. Not to mention, certain ads like radio or TV spots simply cannot be tracked for marketing efficiency. There needs to be a way to step back and see the macro view on how the total marketing budget is driving total sales. MER is your answer.
Attribution. Due to omnichannel marketing, marketers often run into problems of attribution. It gets even more complicated due to varying types of attribution models (last touch attribution, single vs. multi-touch attribution, time decay attribution, and so on). Without having to go into the details, MER gives you your overall score, so you can compare historical data to current data and determine if your marketing budget is being well spent. Find out how to assess your MER score.
Budget allocation. You can use your MER as a highly efficient way of determining your overall marketing budget based on sales goals, as well as allocating budgets to specific marketing activities. Find out how to use MER for budget allocation.
Now that we have an overall health check of your store, we can zoom in to the necessary reports for specific roles, such as performance marketing, operations, and product management.
Your performance marketing metrics
Performance marketers would need two types of reports: a dashboard view with daily actionable insights, as well as individual reports and queries to drill down into the details.
You can get a dashboard view from Airboxr’s homepage. This is where you get all the core metrics relating to your ad campaigns, in one single view.

Marketing metrics to track
The most important marketing metrics to track during peak sales season are:
Daily campaign performance (conversions, ad spend) for each ad channel
Daily keyword performance (impressions, clicks, CTR, ad spend)
Daily keyword search impression share
Daily sales from email marketing
Daily organic traffic referrals
While keeping an eye on daily performance is essential for the fast paced sales periods, it is also helpful to be able to compare to your monthly metrics, so you have a sense of the bigger picture. This also helps you to quickly get a sense of whether any budget adjustments are needed.
Should the marketing performance seem unsatisfactory, you may wish to drill down into individual campaign reports to quickly determine which campaigns or ad sets you should make adjustments to. From within the Airboxr dashboard, you can click on buttons along the timeline of insights which would automatically pull a detailed report for you into your Google Spreadsheet, for further analysis.
Important marketing reports
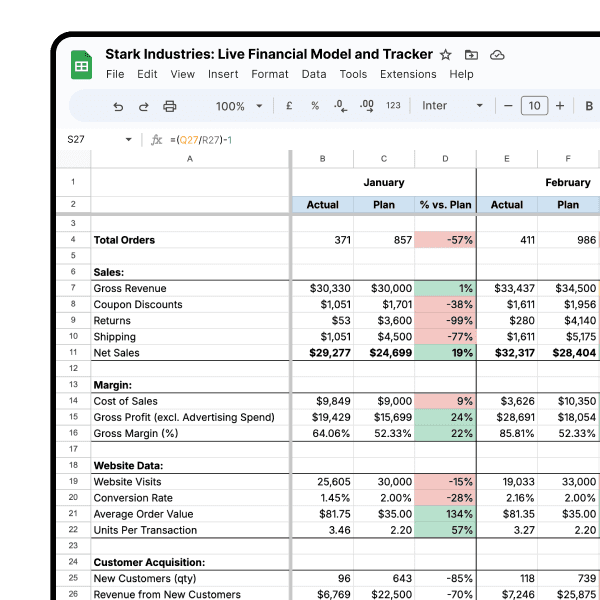
Use these automated reports to measure the effectiveness of your marketing efforts.
Improve your DTC game. Sign up for weekly tips.
Your shipping and operational metrics
Peak sales season is usually when the operations department is the most stressed. With a huge influx of orders within a short period of time, it’s essential to be able to stay on top of every single order fulfilment and delivery process.
Most of the time, stores will work with 3PL partners and logistics companies to handle the shipping. Nevertheless, there are steps along the process that need to be monitored - and are often overlooked. Keeping track of these metrics will allow an operations manager to identify any potential inefficiencies in the fulfilment and delivery process, and address them immediately.
Operations metrics to track
The most important operations metrics to track during peak sales season are:
A summary of your active available inventory (daily)
How quickly your team ships orders out (daily)
How long your shipping partners take to deliver shipments (post-sales period review)
Important operations reports
Use these automated reports to measure the effectiveness of your operations.
Shipout Performance (based on In Transit timestamp in Shopify)
Shipper Performance (from In Transit to Delivered in Shopify)
Delivery Performance (based on Delivered At timestamp in Shopify)
Most 3PL companies will send the In Transit and Delivered At timestamp back into your Shopify order, which will allow you to review their Delivery Performance.
Having a single view into all of your store’s core metrics during peak sales period greatly reduces stress during a very fast paced time. Automated insights and reports can not only save time and free up your energy to work on other things such as customer service, but also help you reduce your bandwidth at work, allowing you to perform your best.


