Tools & Templates
05.09.2022

TLDR
Automate your D2C e-commerce brand's data analysis with Airboxr's Hops, covering revenue, marketing, operations, SEO, and social metrics. For instance, the "D2C Marketing KPI Report" provides a comprehensive marketing dashboard, while "Gross Sales" tracks revenue trends. "Average Customer Value" helps assess customer spending, and "Conversions by Source/Medium" pinpoints top-performing marketing channels. These automated reports save time and provide valuable insights, accessible through Airboxr from the Shopify App Store.
As a growing D2C e-commerce brand, you need to access data fast to make effective business decisions. Waiting for your analytics team to create reports can cost you more than just time—you can lose valuable customers or run out of important inventory before the data is prepared for you.
There are five key categories of data you should look at:
Revenue
Marketing
Operations
SEO
Social
You can use Airboxr to run queries on these data types automatically. You can then build data visualization dashboards, or simply continue working on the data immediately without the extra step of downloading a CSV file.
In this article, we’ll highlight several automated queries (which we call Hops) that could become your essential daily reports. Let’s get into it.
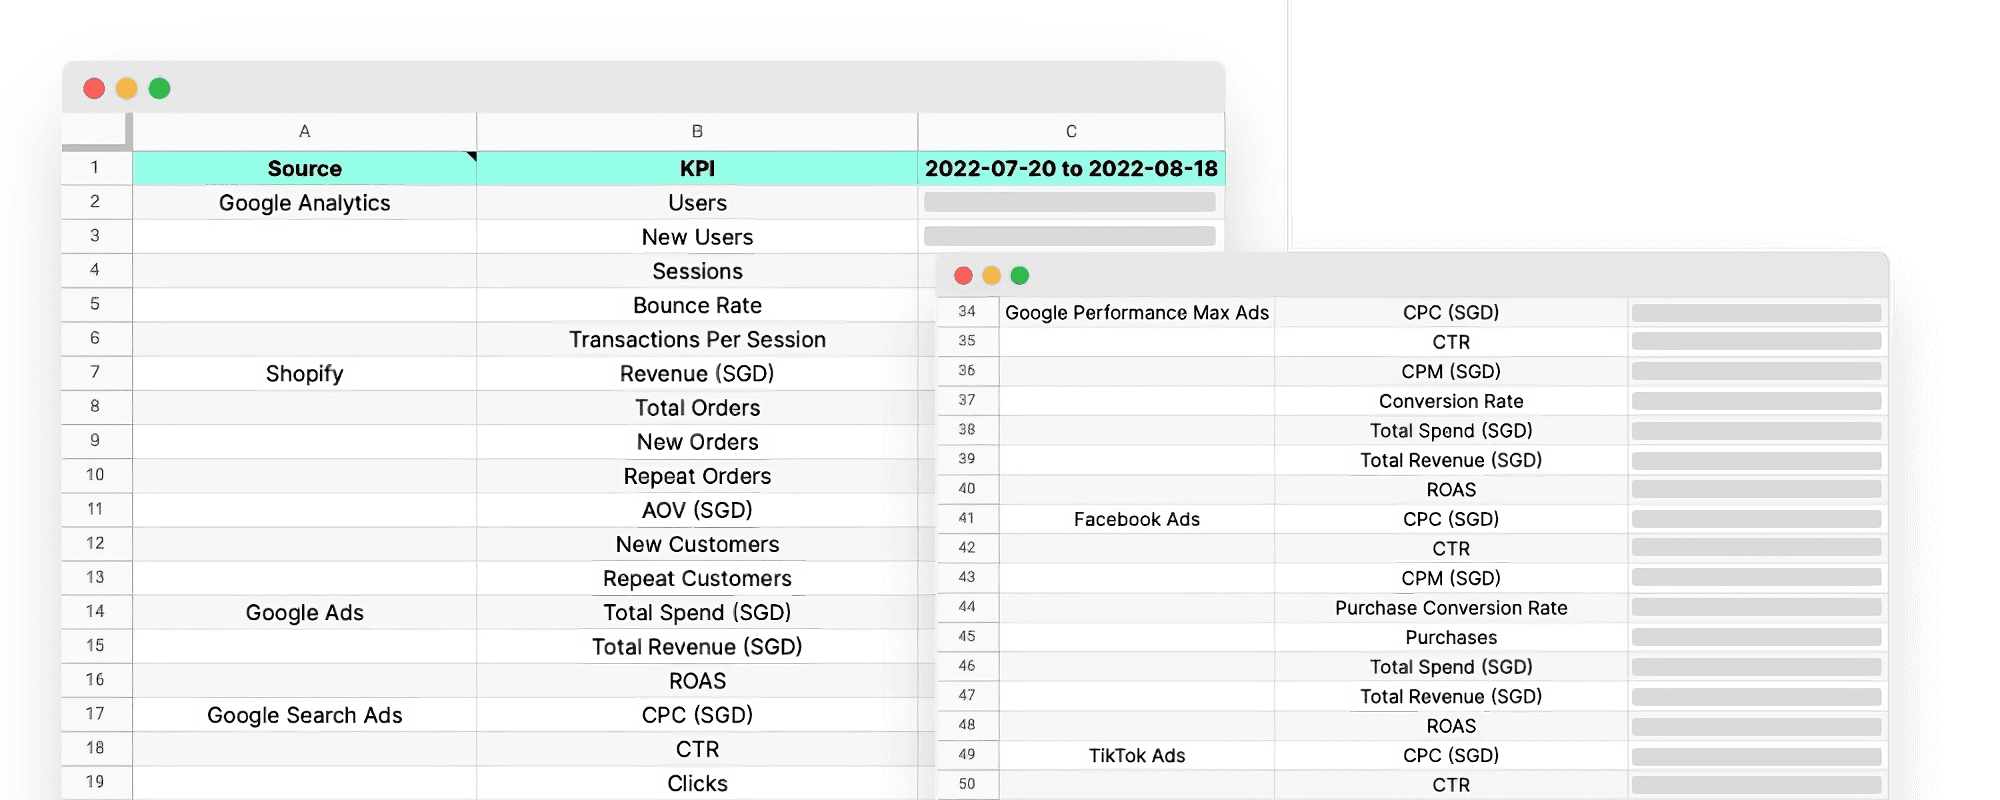
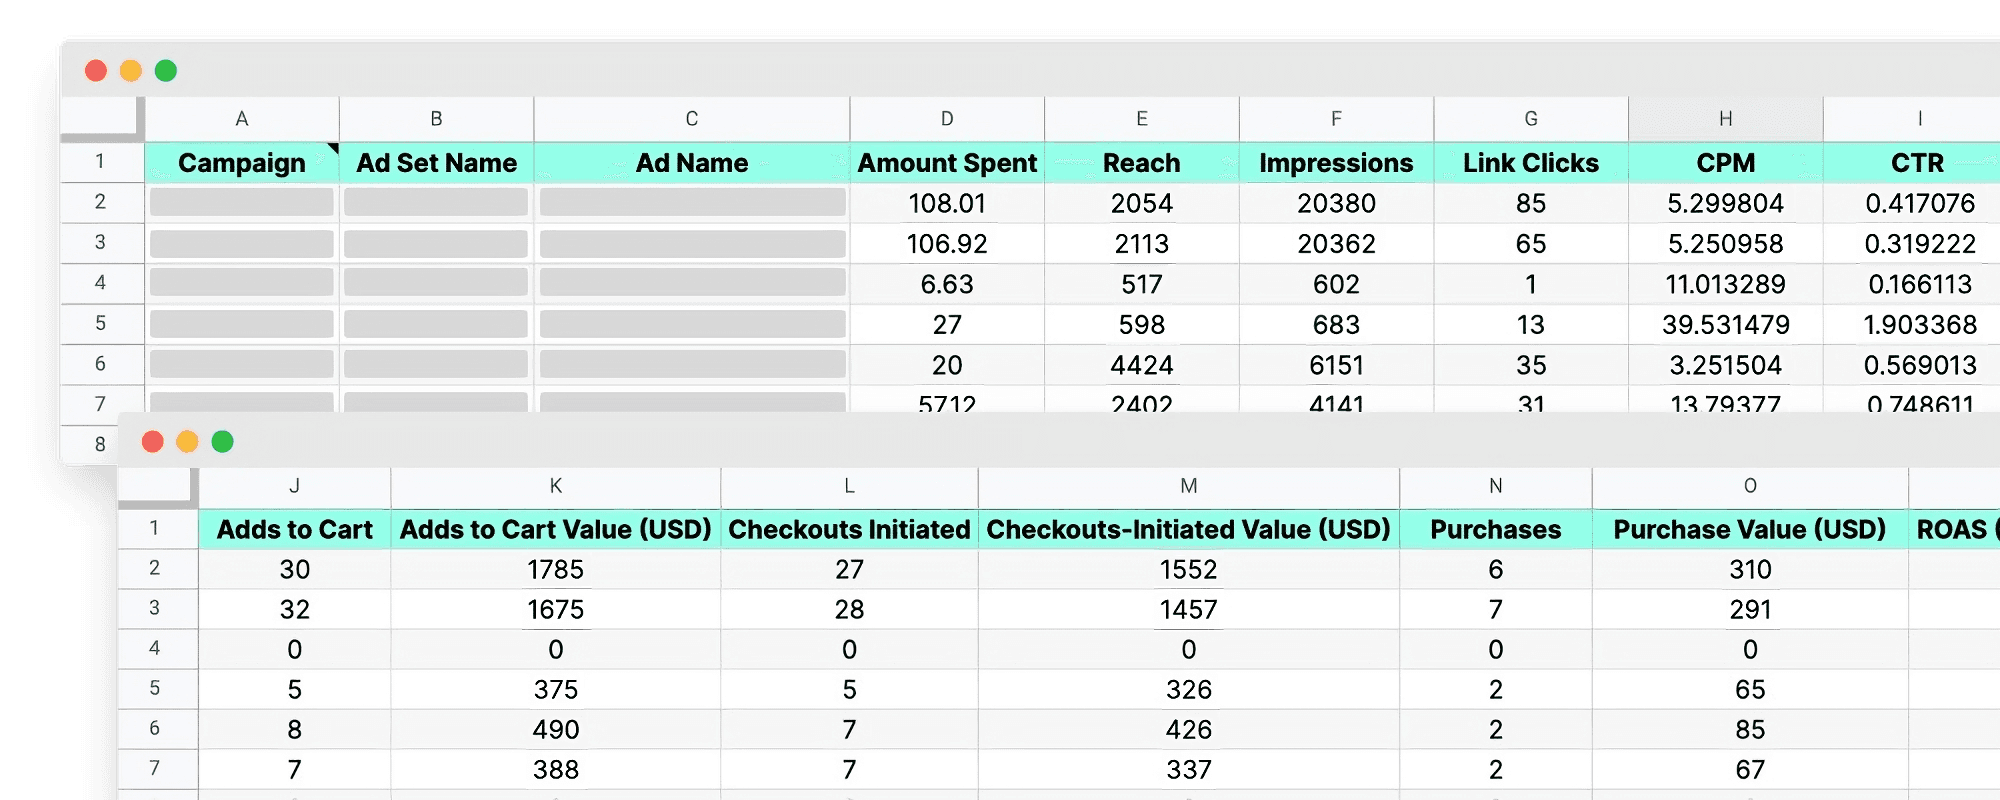
Review key marketing KPIs for your D2C store
Hop name: D2C Marketing KPI Report
Category: Revenue
Source: Shopify, Google Ads, Facebook Ads, TikTok Ads, Google Analytics
What’s the one thing every performance marketer wishes they had? A dashboard to view all of their marketing campaigns across all ad platforms at once.
A user from the supplement industry in India was spending hours laboriously plugging in data from various data sources into a spreadsheet for their monthly internal reporting. With this Hop, they are able to get all their marketing, sales and revenue data pulled in to a spreadsheet in one click.
Use this Hop to get a quick view into your marketing team's performance. Schedule this Hop to run weekly before your weekly KPI meetings.
Also read: D2C Marketing KPI Report: metrics to track for your store
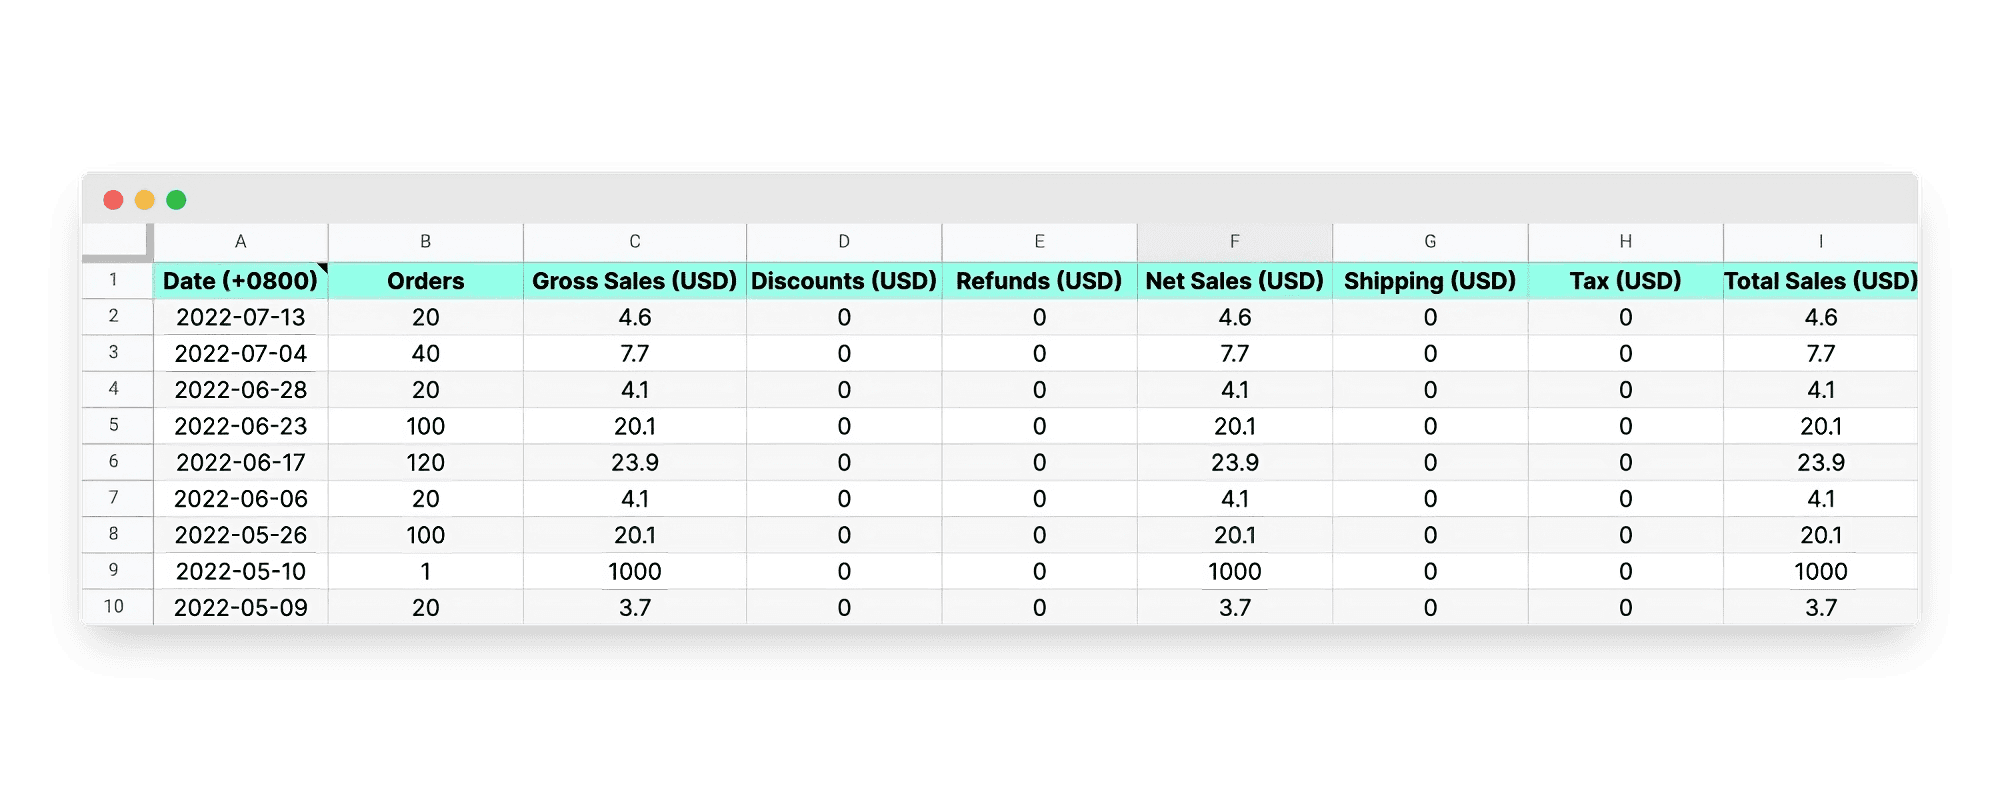
Review your sales trends over time
Hop name: Gross Sales
Category: Revenue
Source: Shopify
How well is your business generating revenue? Are the current campaigns and promotions working to grow your total sales?
This Hop gives you an overview into your sales data, minus discounts, refunds, shipping and tax. Refunds are calculated on the date of order.
If you are running specific campaigns with special discounts, this is a great way to check your campaigns’ impact on sales revenue for the month.
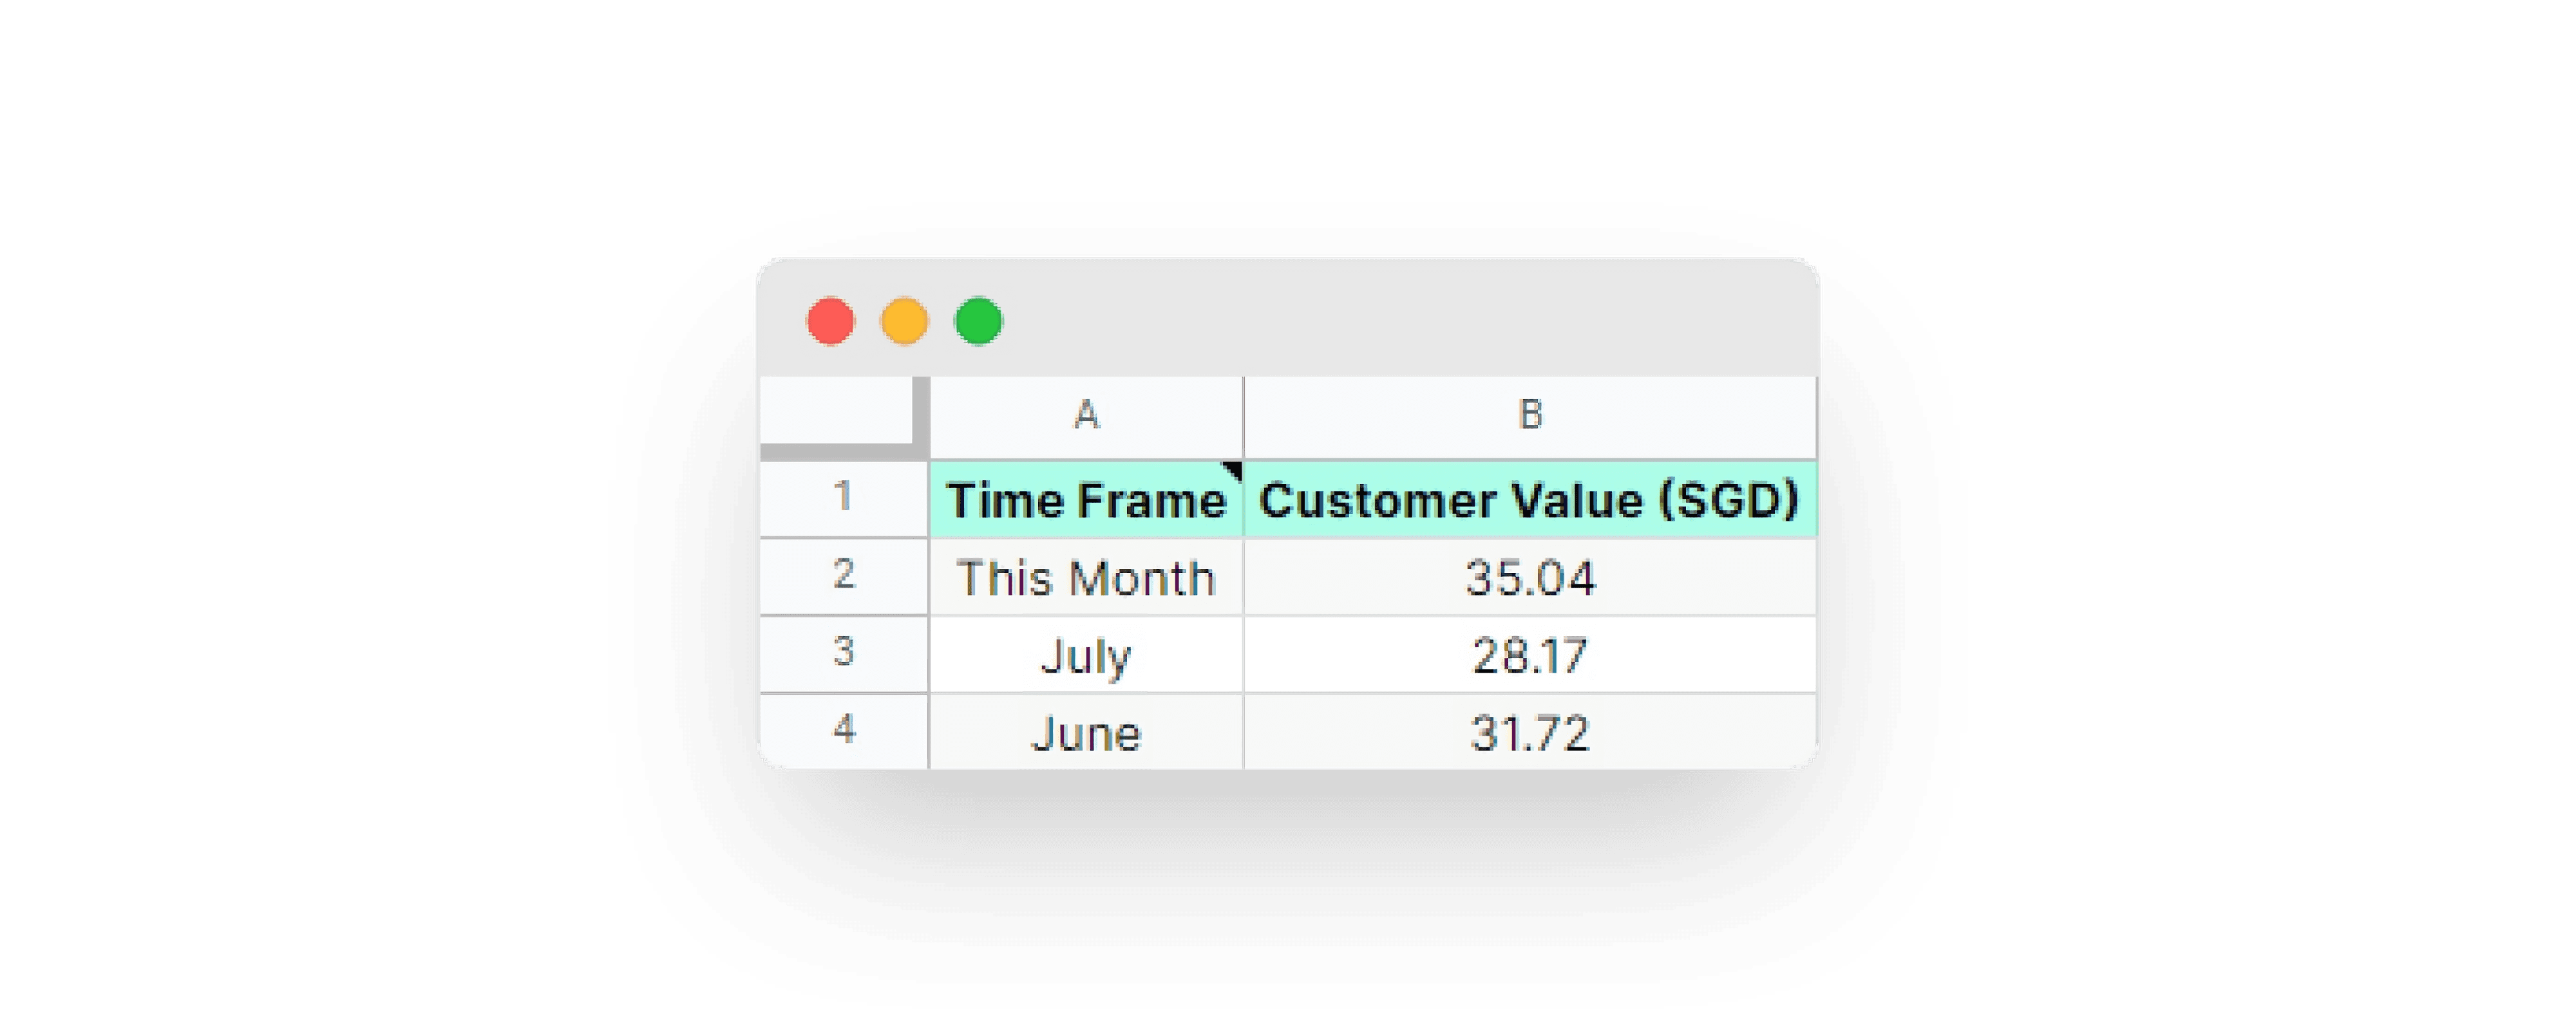
Measure your average customer value over time
Hop name: Average Customer Value
Category: Revenue
Source: Shopify
For early stage stores, you may not yet have enough data on your customers’ lifetime value (LTV)—but you can use average customer value as a proxy to know if you should tweak your marketing strategy.
A user in the food & beverage industry in Singapore uses this Hop to check whether or not they are satisfied with the average cart value of their existing customers, or whether they need to double down on their marketing efforts to cross sell and upsell.
This Hop looks at average spend per customer over the last three months. If your average customer value is increasing over the months, you know your customers are picking up what you’re putting down.
Identify the traffic sources leading to most conversions
Hop name: Conversions by Source/Medium
Category: Marketing
Source: Google Analytics
Which marketing channels are really bringing in the dough? Shopify’s standard report doesn’t show you this - you need to enable enhanced e-commerce tracking using Google Analytics to get more accurate conversions data.
Conversions are the most important metric to measure the effectiveness of your marketing efforts. The higher the e-commerce conversions from your campaigns, the more effective your marketing efforts are.
By getting an overview of your best converting traffic sources, you can make decisions on which sources to focus more marketing efforts towards, and which to scrap. Use this Hop to design a deliberate strategy to leverage traffic sources that consistently provide conversions.
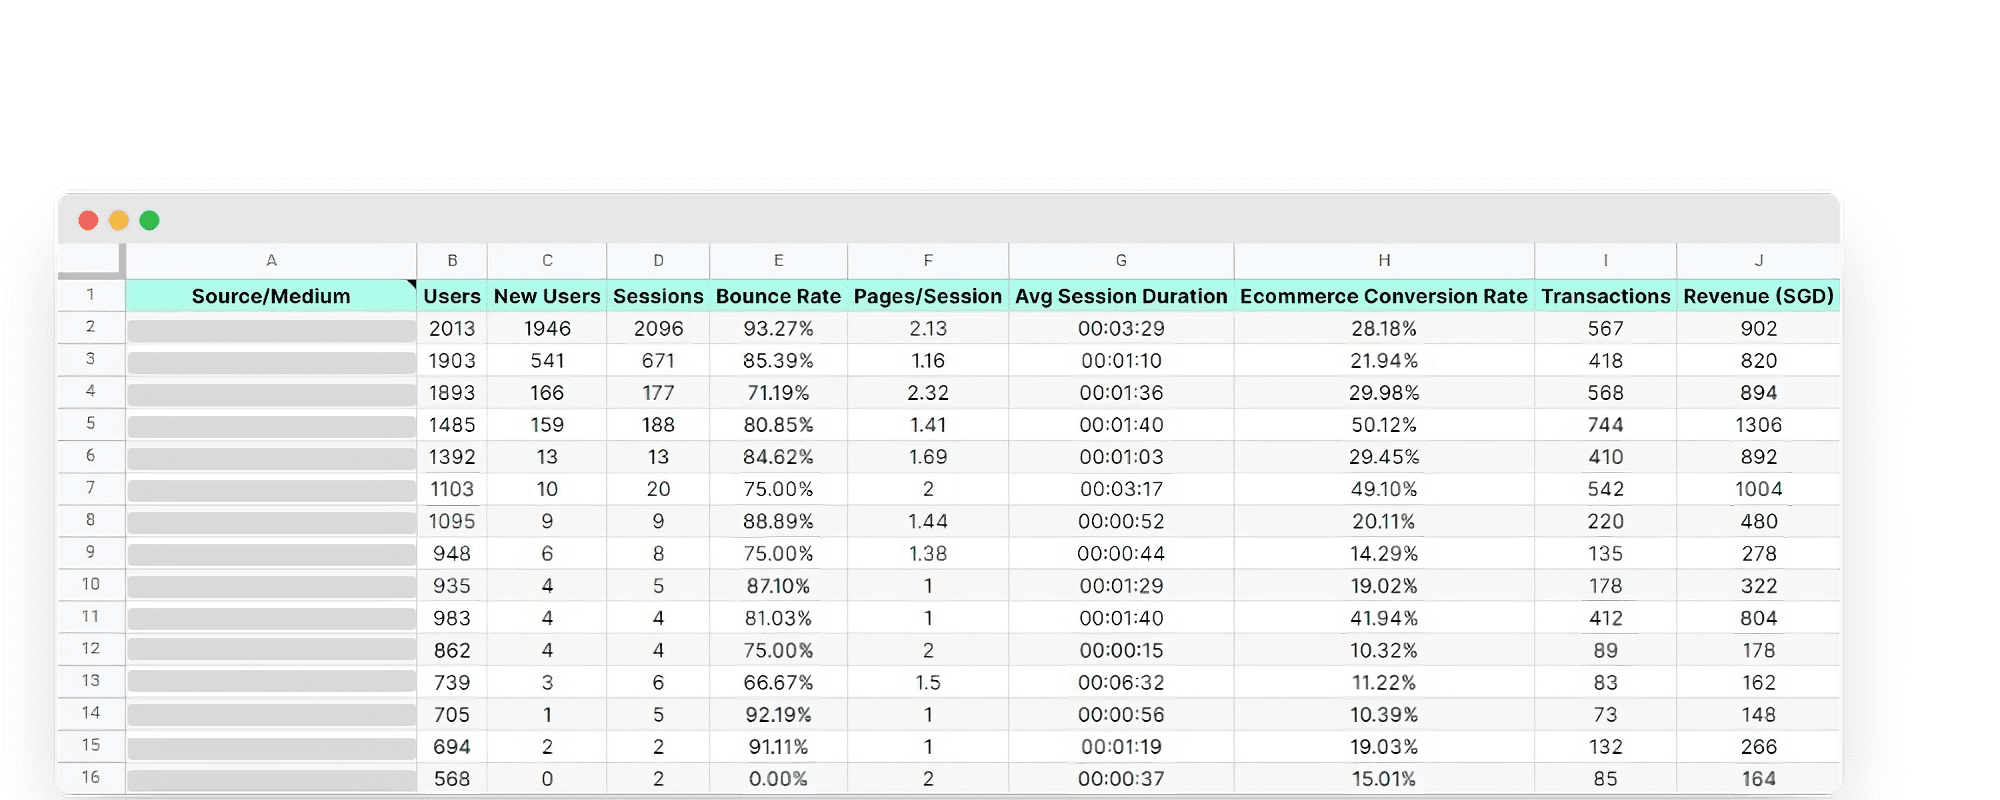
Also read: How to track e-commerce conversions on your Shopify store

Review the core Facebook ad stats for your D2C store
Hop name: Core Ad Stats for E-commerce
Category: Marketing
Source: Facebook
Running Facebook ad campaigns? You’ll want to know how conversions are doing—how are they driving Add to Carts, Purchases, and Return On Ad Spend (ROAS)? Having this overview of your Facebook ad stats for e-commerce lets you identify your best performing campaigns, compare metrics across campaigns and determine which ones to put more money behind or which to drop, based on your company’s goals.
Use this Hop to check on your campaign performance every day. Note: for this to work properly, your Facebook tag must be set up to track e-commerce conversions.
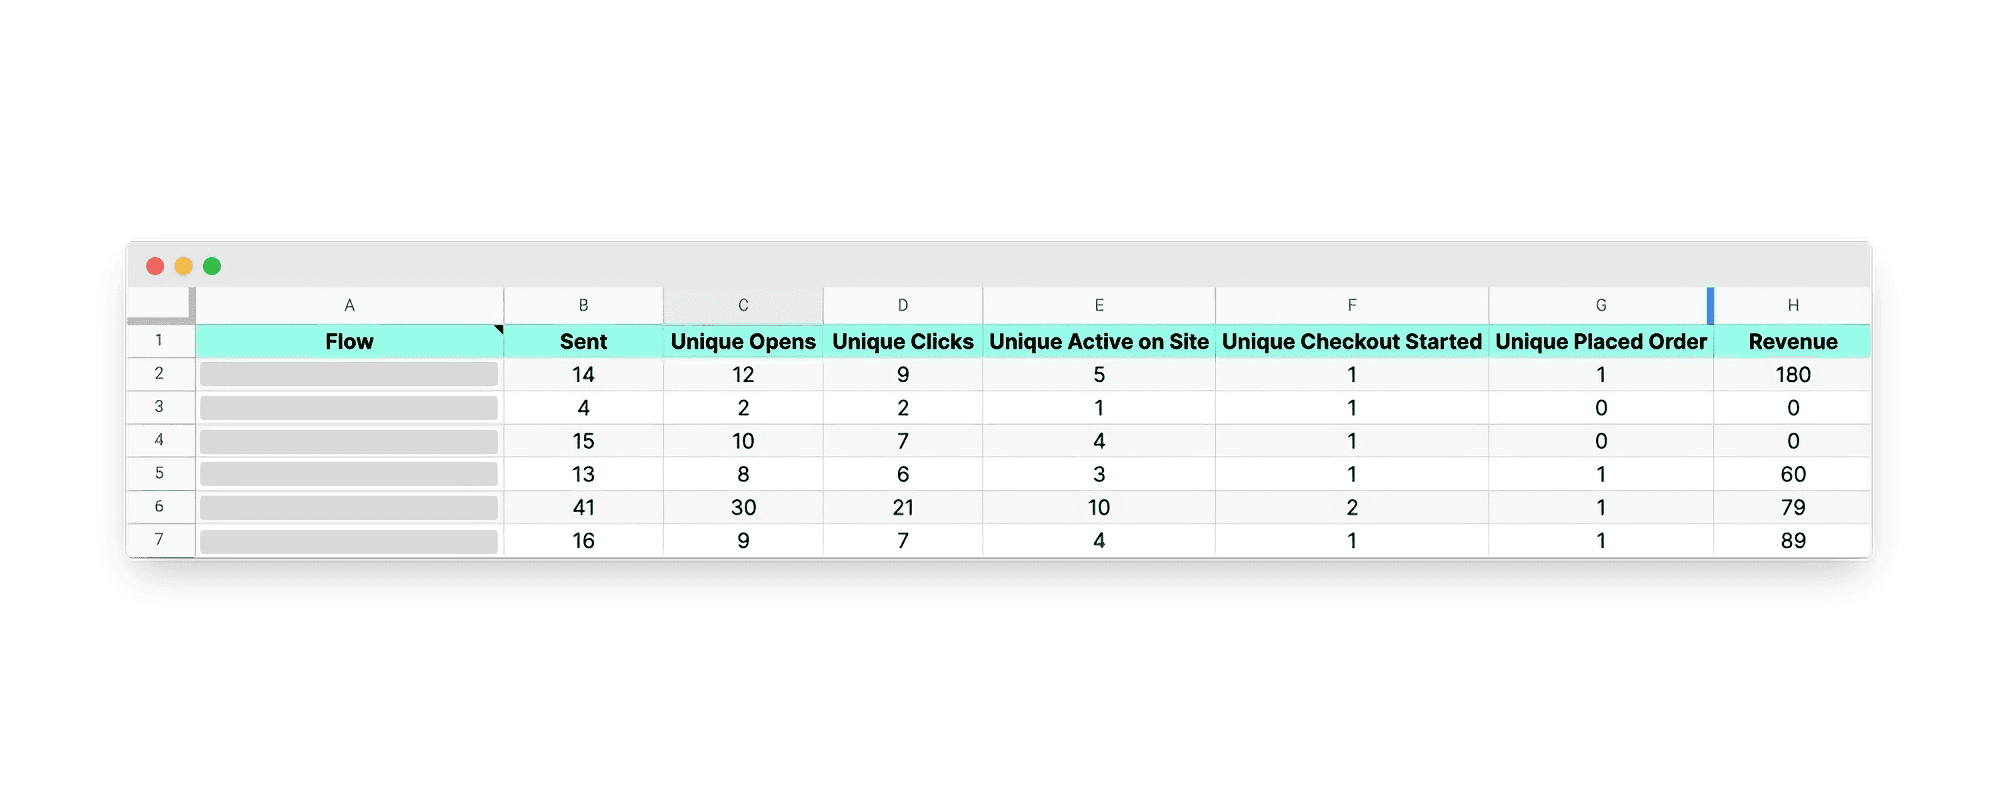
Measure the checkout performance of your e-mail flows
Hop name: Checkout Performance by Email Flow
Category: Marketing
Source: Klaviyo
E-mail flow automations are a great way to constantly re-engage customers, getting the right marketing messages in front of them at the right time. Make sure you have set up automated e-mails for key customer drop-off points.
Any e-commerce store would likely have multiple flows set up—this Hop allows you to view all of their performance side by side. Analyze open-, click-, and conversion rates across all your email flows.
Use this Hop to monitor the conversion rates of your flows. By reviewing this data, you might plan to add more emails to the flow, tweak the existing content, or rework the entire flow altogether. Schedule the Hop to look for trends in your email marketing automation performance.
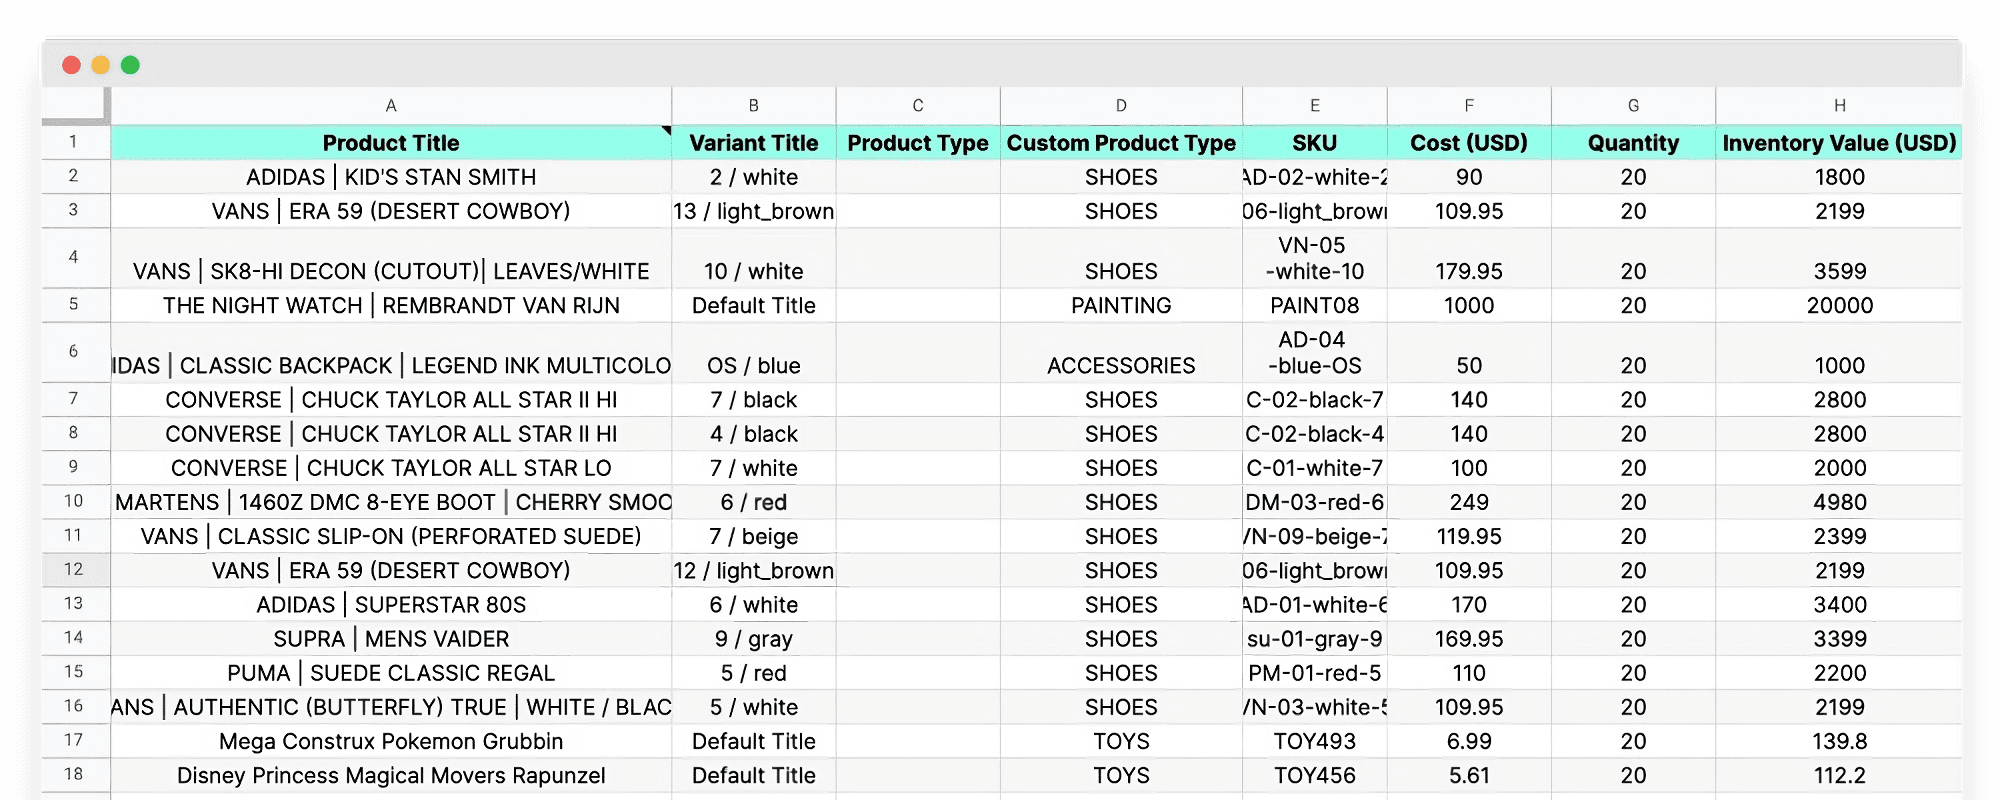
Create a snapshot of your available inventory
Hop name: Active Inventory Snapshot
Category: Operations
Source: Shopify
When your products move fast, you need to stay on top of your inventory to avoid out of stock notices and disappointed customers.
An electronics retailer in Australia relies on this Hop for a quick overview of their fast-moving product inventory. They keep the Hop running on a schedule so that the report shows up in their email inbox every morning.
This Hop shows your active inventory quantity, cost, and total value. Results are grouped by product- and variant-title, archived and draft product variants are ignored. Use this to prepare restocks ahead of time, or review slow moving stocks and run clearance sales.
Improve your DTC game. Sign up for weekly tips.
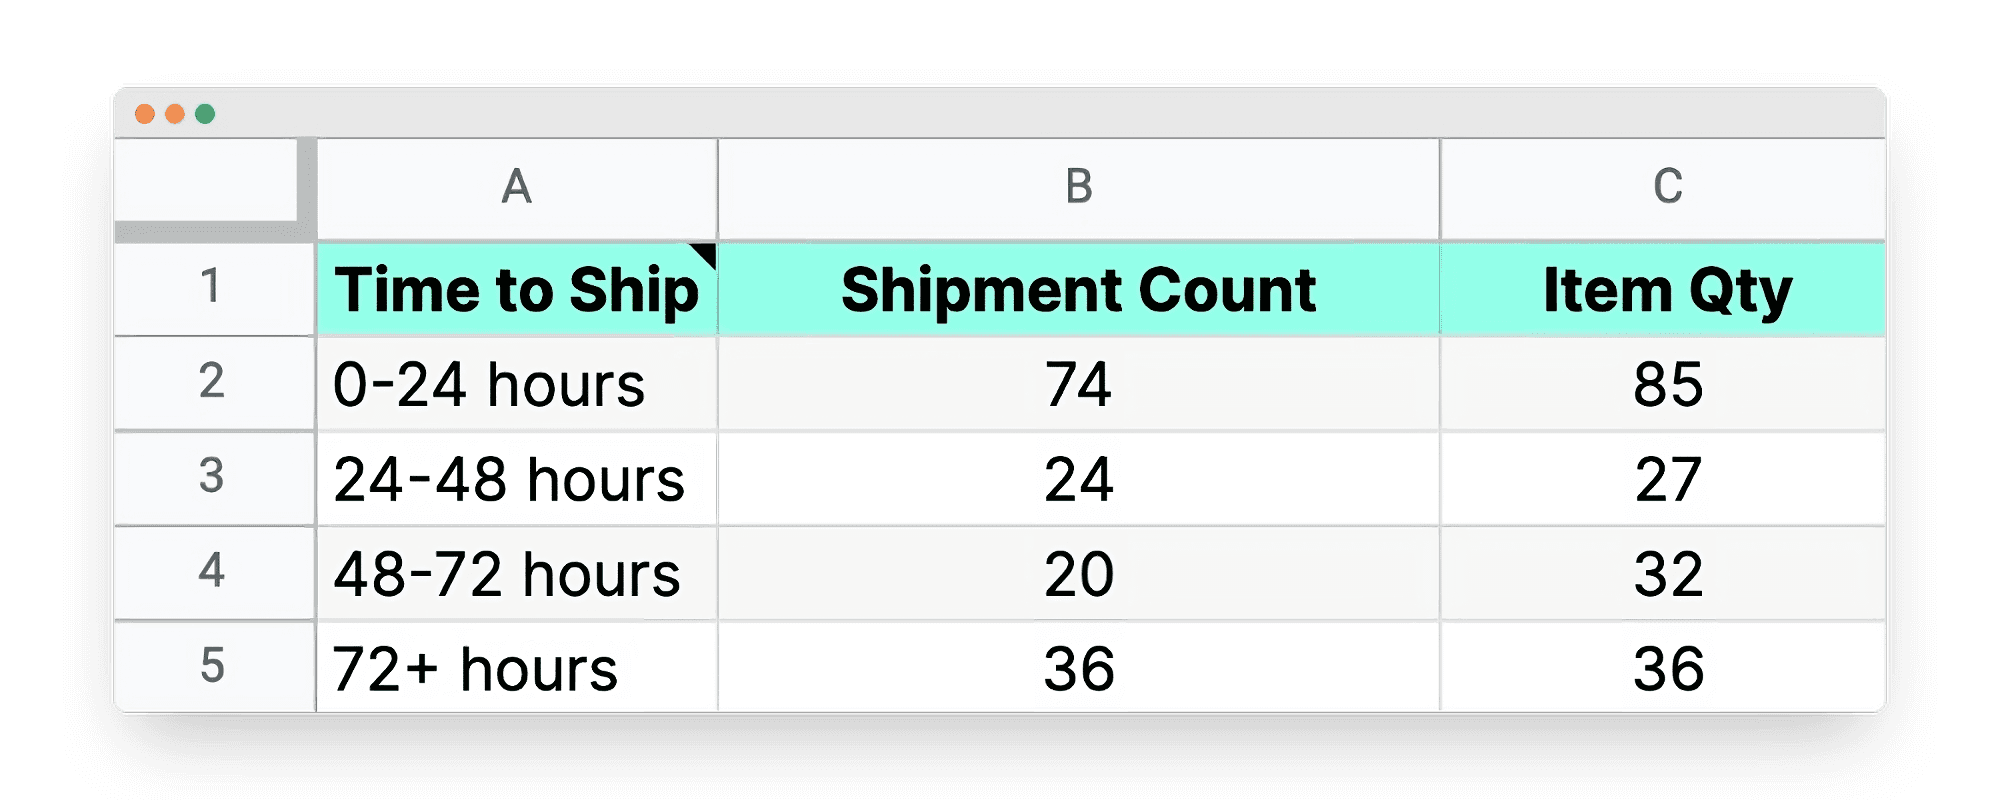
Measure the efficiency of your fulfilment team
Hop name: Shipout Performance
Category: Operations
Source: Shopify
Keep track of how efficient your fulfilment team is, with this Hop showing how many orders and items were shipped out within various time frames. Use this to observe for any unreasonable time delays in shipping out orders, or to measure consistent good performance from your operations team.
Run this Hop on a monthly schedule and compare performance across the months to observe for consistency or changes in your fulfilment processes. Measure alongside product return rates to determine the impact of slow shipments.
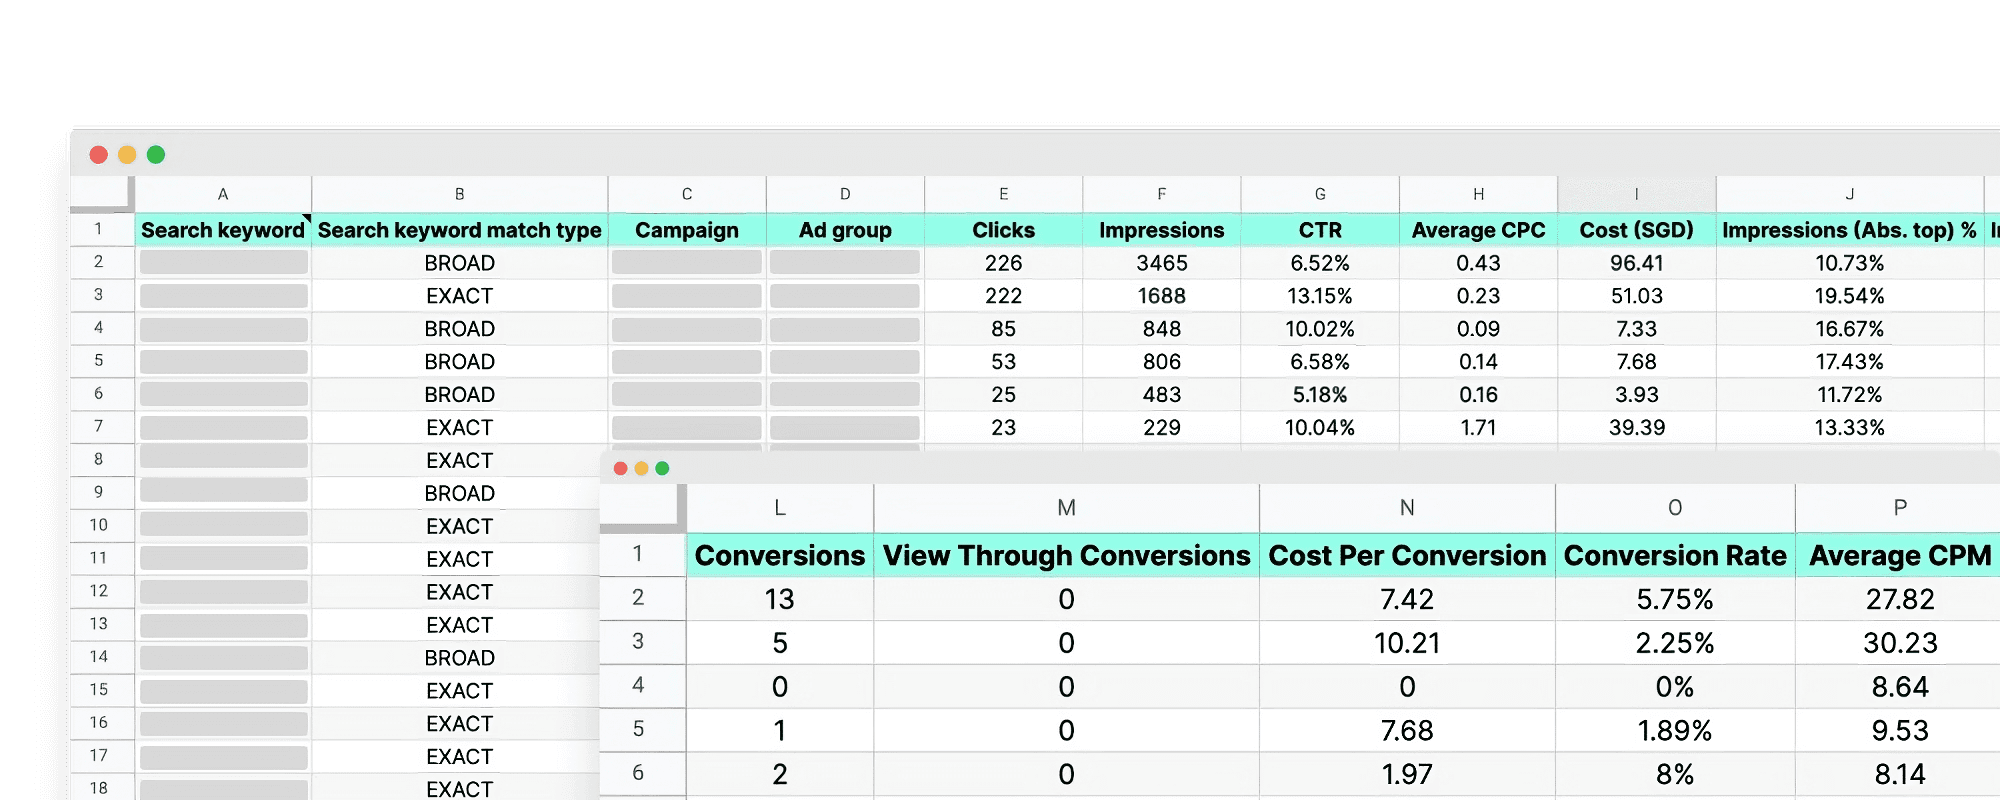
Measure the performance of your Google Ad keywords
Hop name: Google Ads Keyword Performance
Category: SEO
Source: Google Ads
When you’re spending money on keywords, you want to know which ones are doing well. This Hop shows you the performance of your search keywords.
Use this Hop to measure click-through rates and conversions, to help determine which keywords to retain and which to drop.
This is an essential report for your marketing team. Schedule this to run every morning. You can also create charts on top of this report to enable presentation to a broader audience.
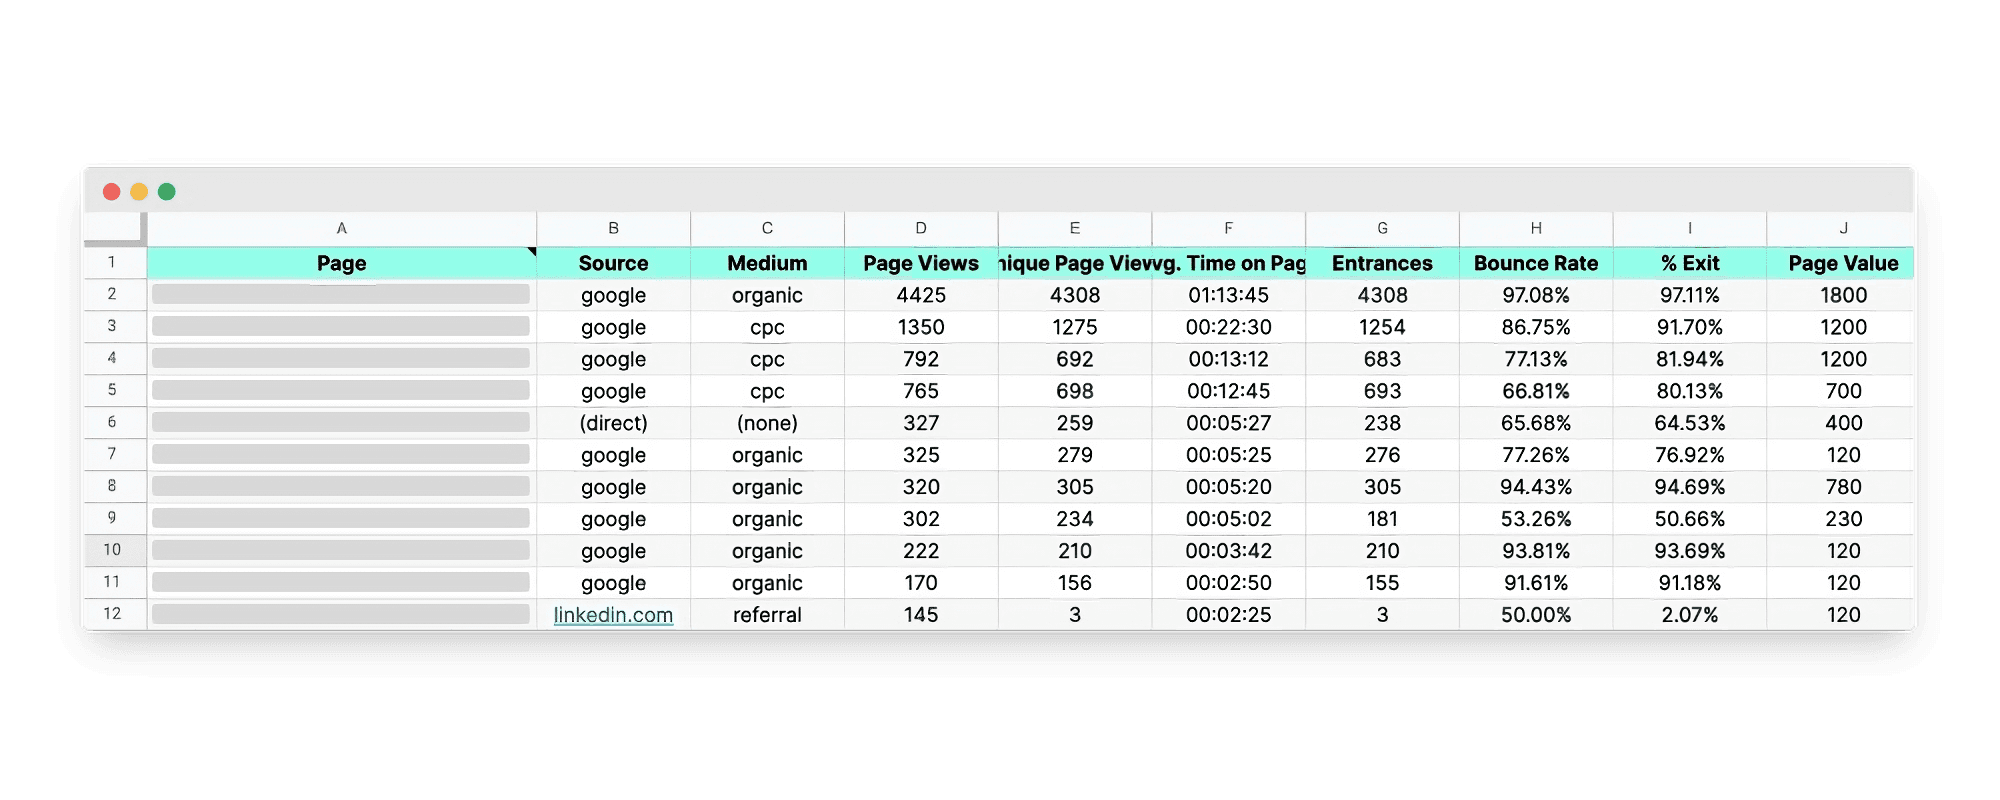
Identify the content that gets most engagement
Hop name: Content Performance
Category: SEO
Source: Google Analytics
A lifesaver for anyone working on organic marketing through content creation. This Hop pulls a list of your content pages, alongside page view data and page value.
Use this Hop to identify your best performing pieces of content. You may want to create more of that sort of content, or plan to put in ad spend towards those pages.
Having your reports automated makes staying on top of business metrics much easier and faster, taking the stress out of gathering the data. Plus, having a list of pre-made queries makes it easier for you to know what metrics to focus on.
Get Airboxr from the Shopify App store now and start using these Hops within minutes.