Reporting & Analysis
22.04.2022
TLDR
Identifying your most valuable e-commerce customers through RFM analysis, based on Recency, Frequency, and Monetary value, is crucial for prioritizing marketing efforts and fostering customer loyalty. You can either export Shopify data and use a spreadsheet to allocate RFM scores to find your most valuable customers, or streamline the process using Airboxr, a tool that simplifies RFM analysis for Shopify stores with a single click.
Identifying your most valuable customers is a core part of building an e-commerce revenue strategy. Identifying the right cohort of customers can help you:
Prioritize your marketing strategies
Target special attention on customers most willing to spend on your store
Make your valuable customers feel special
Since you’re already on this page, I can imagine you are already bought into the need to identify your most valuable customers. So I won’t bore you with the details. Let’s look instead at how we can identify those customers.
Your most valuable customers purchase more frequently and spend more money at your store than others.
One of the ways you can find your most valuable customers is to conduct an RFM analysis. This is what it means:
Recency (R)—Because customers who purchased recently from you are still active and have you top of mind.
Frequency (F)—Because customers that purchase from you often are more likely to come back.
Monetary value (M)—Because customers that spend more at your store are more valuable to nurture.
Thankfully, all of the above information should be easily available in your database or platform you use for your DTC brand. For this article, we will look at how you can get this information from your Shopify store in two ways:
Option A: Exporting your Shopify data and analyzing on a spreadsheet
Step 1: Download your orders from Shopify
Ideally you should look at the last 3 to 6 months of orders data. We will only use the orders export to identify the date of the customer’s last order. Go to your Shopify Admin portal, then go to Orders → Export.
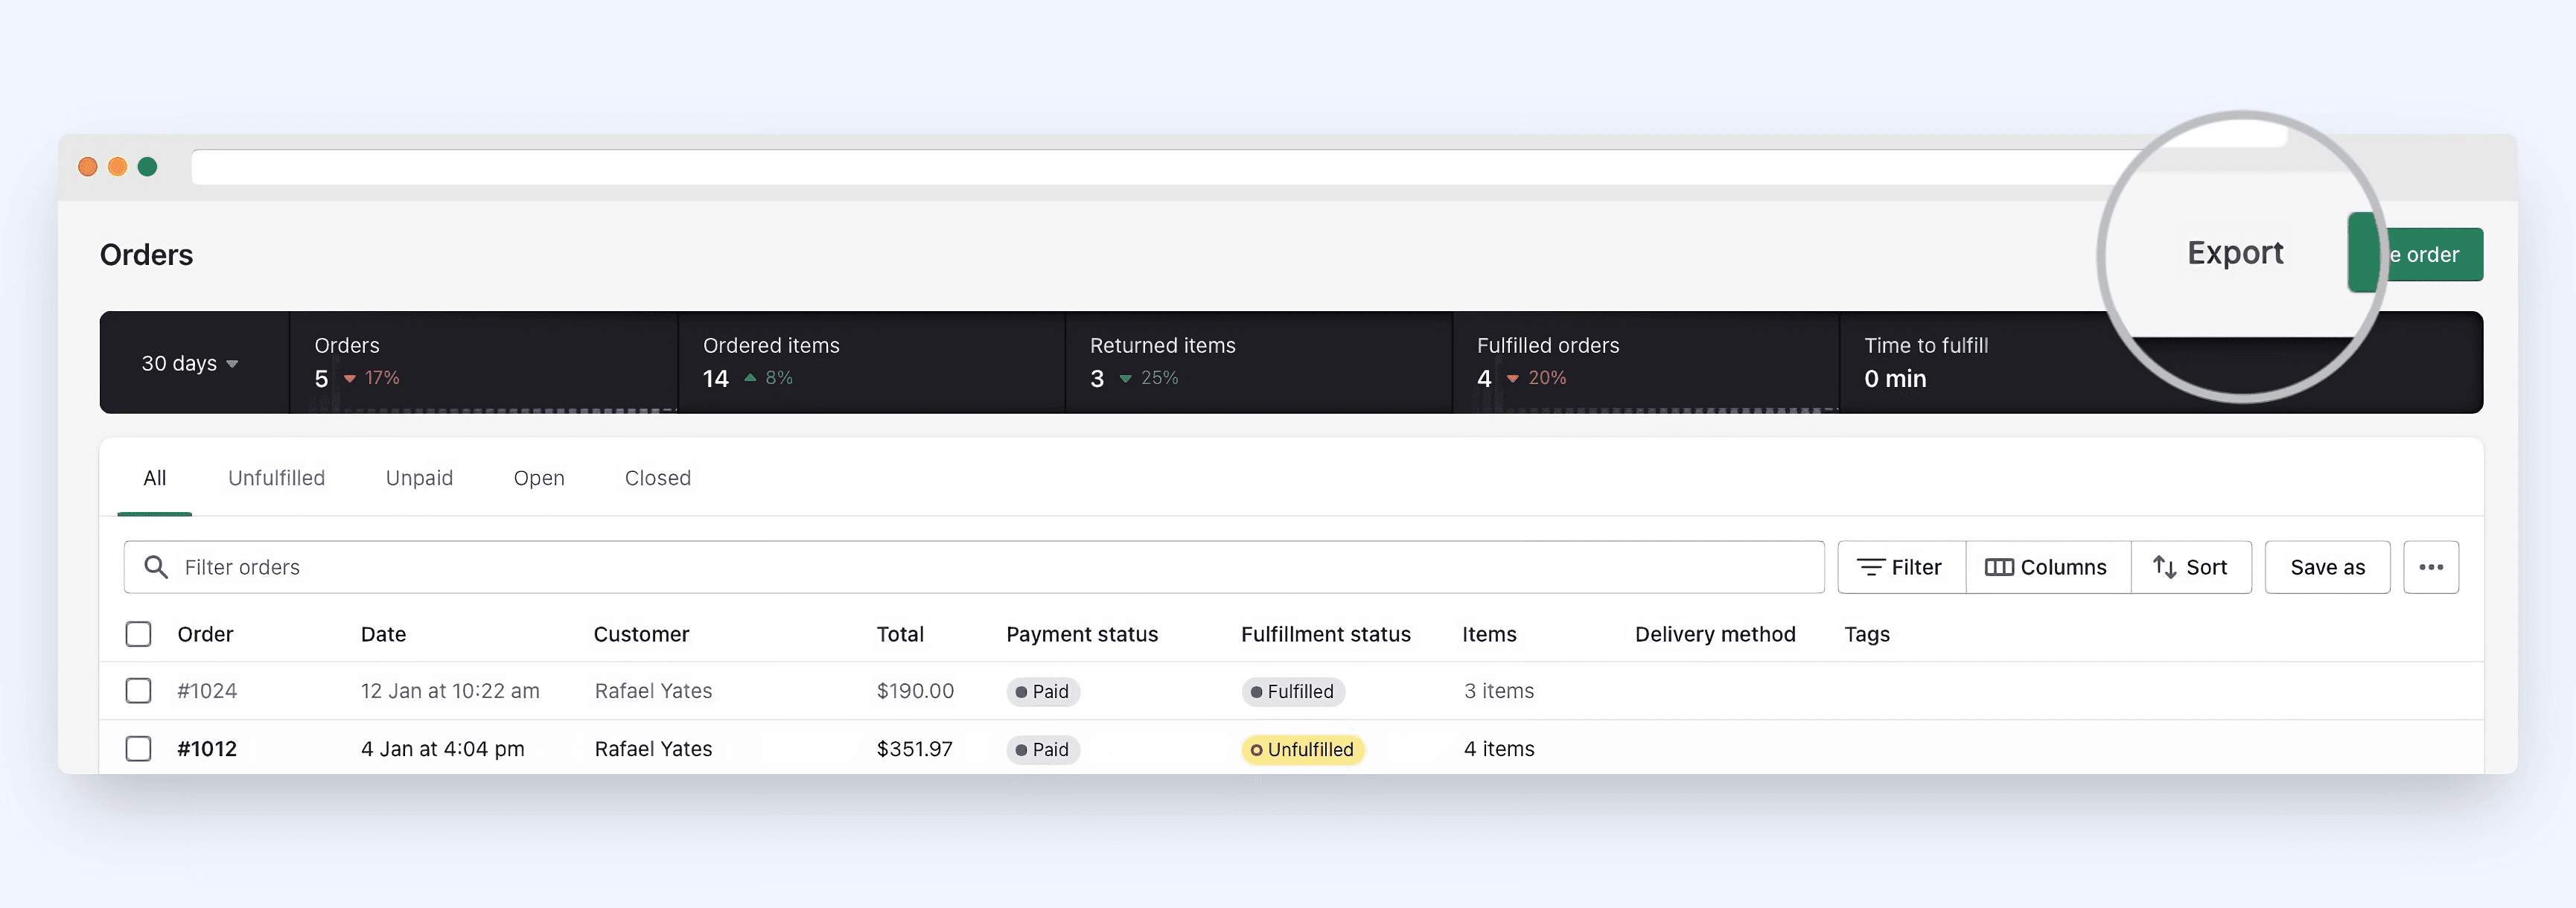
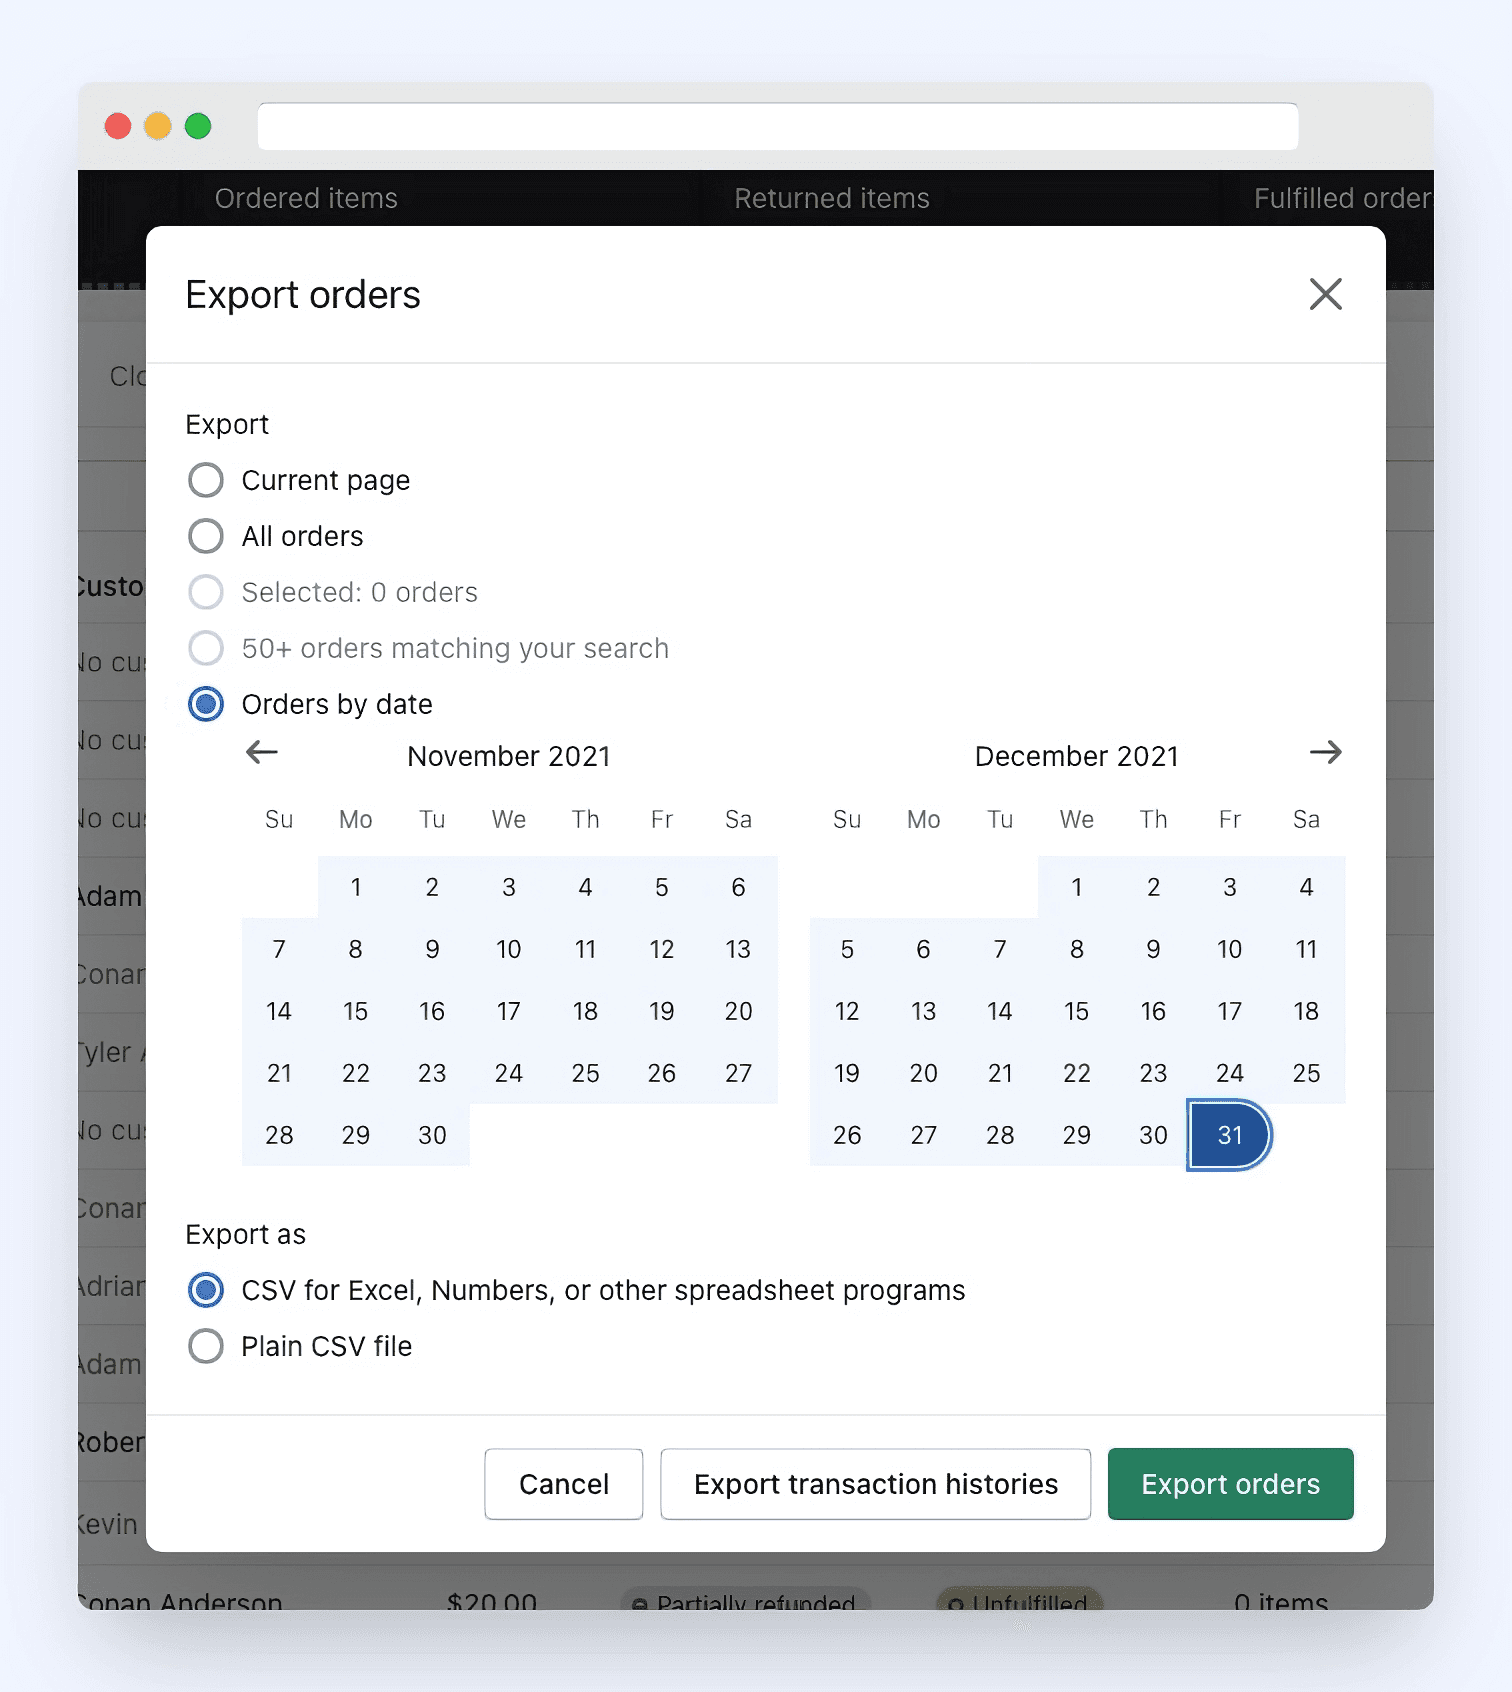
When exporting the orders, use the “Orders by Date” option to select the last 3-6 months of data. If you have less than (say) 10,000 orders during this time, you may wish to download more months of order data.
When exporting the orders, use the “Orders by Date” option to select the last 3-6 months of data. If you have less than (say) 10,000 orders during this time, you may wish to download more months of order data.
Step 2: Download your customers from Shopify
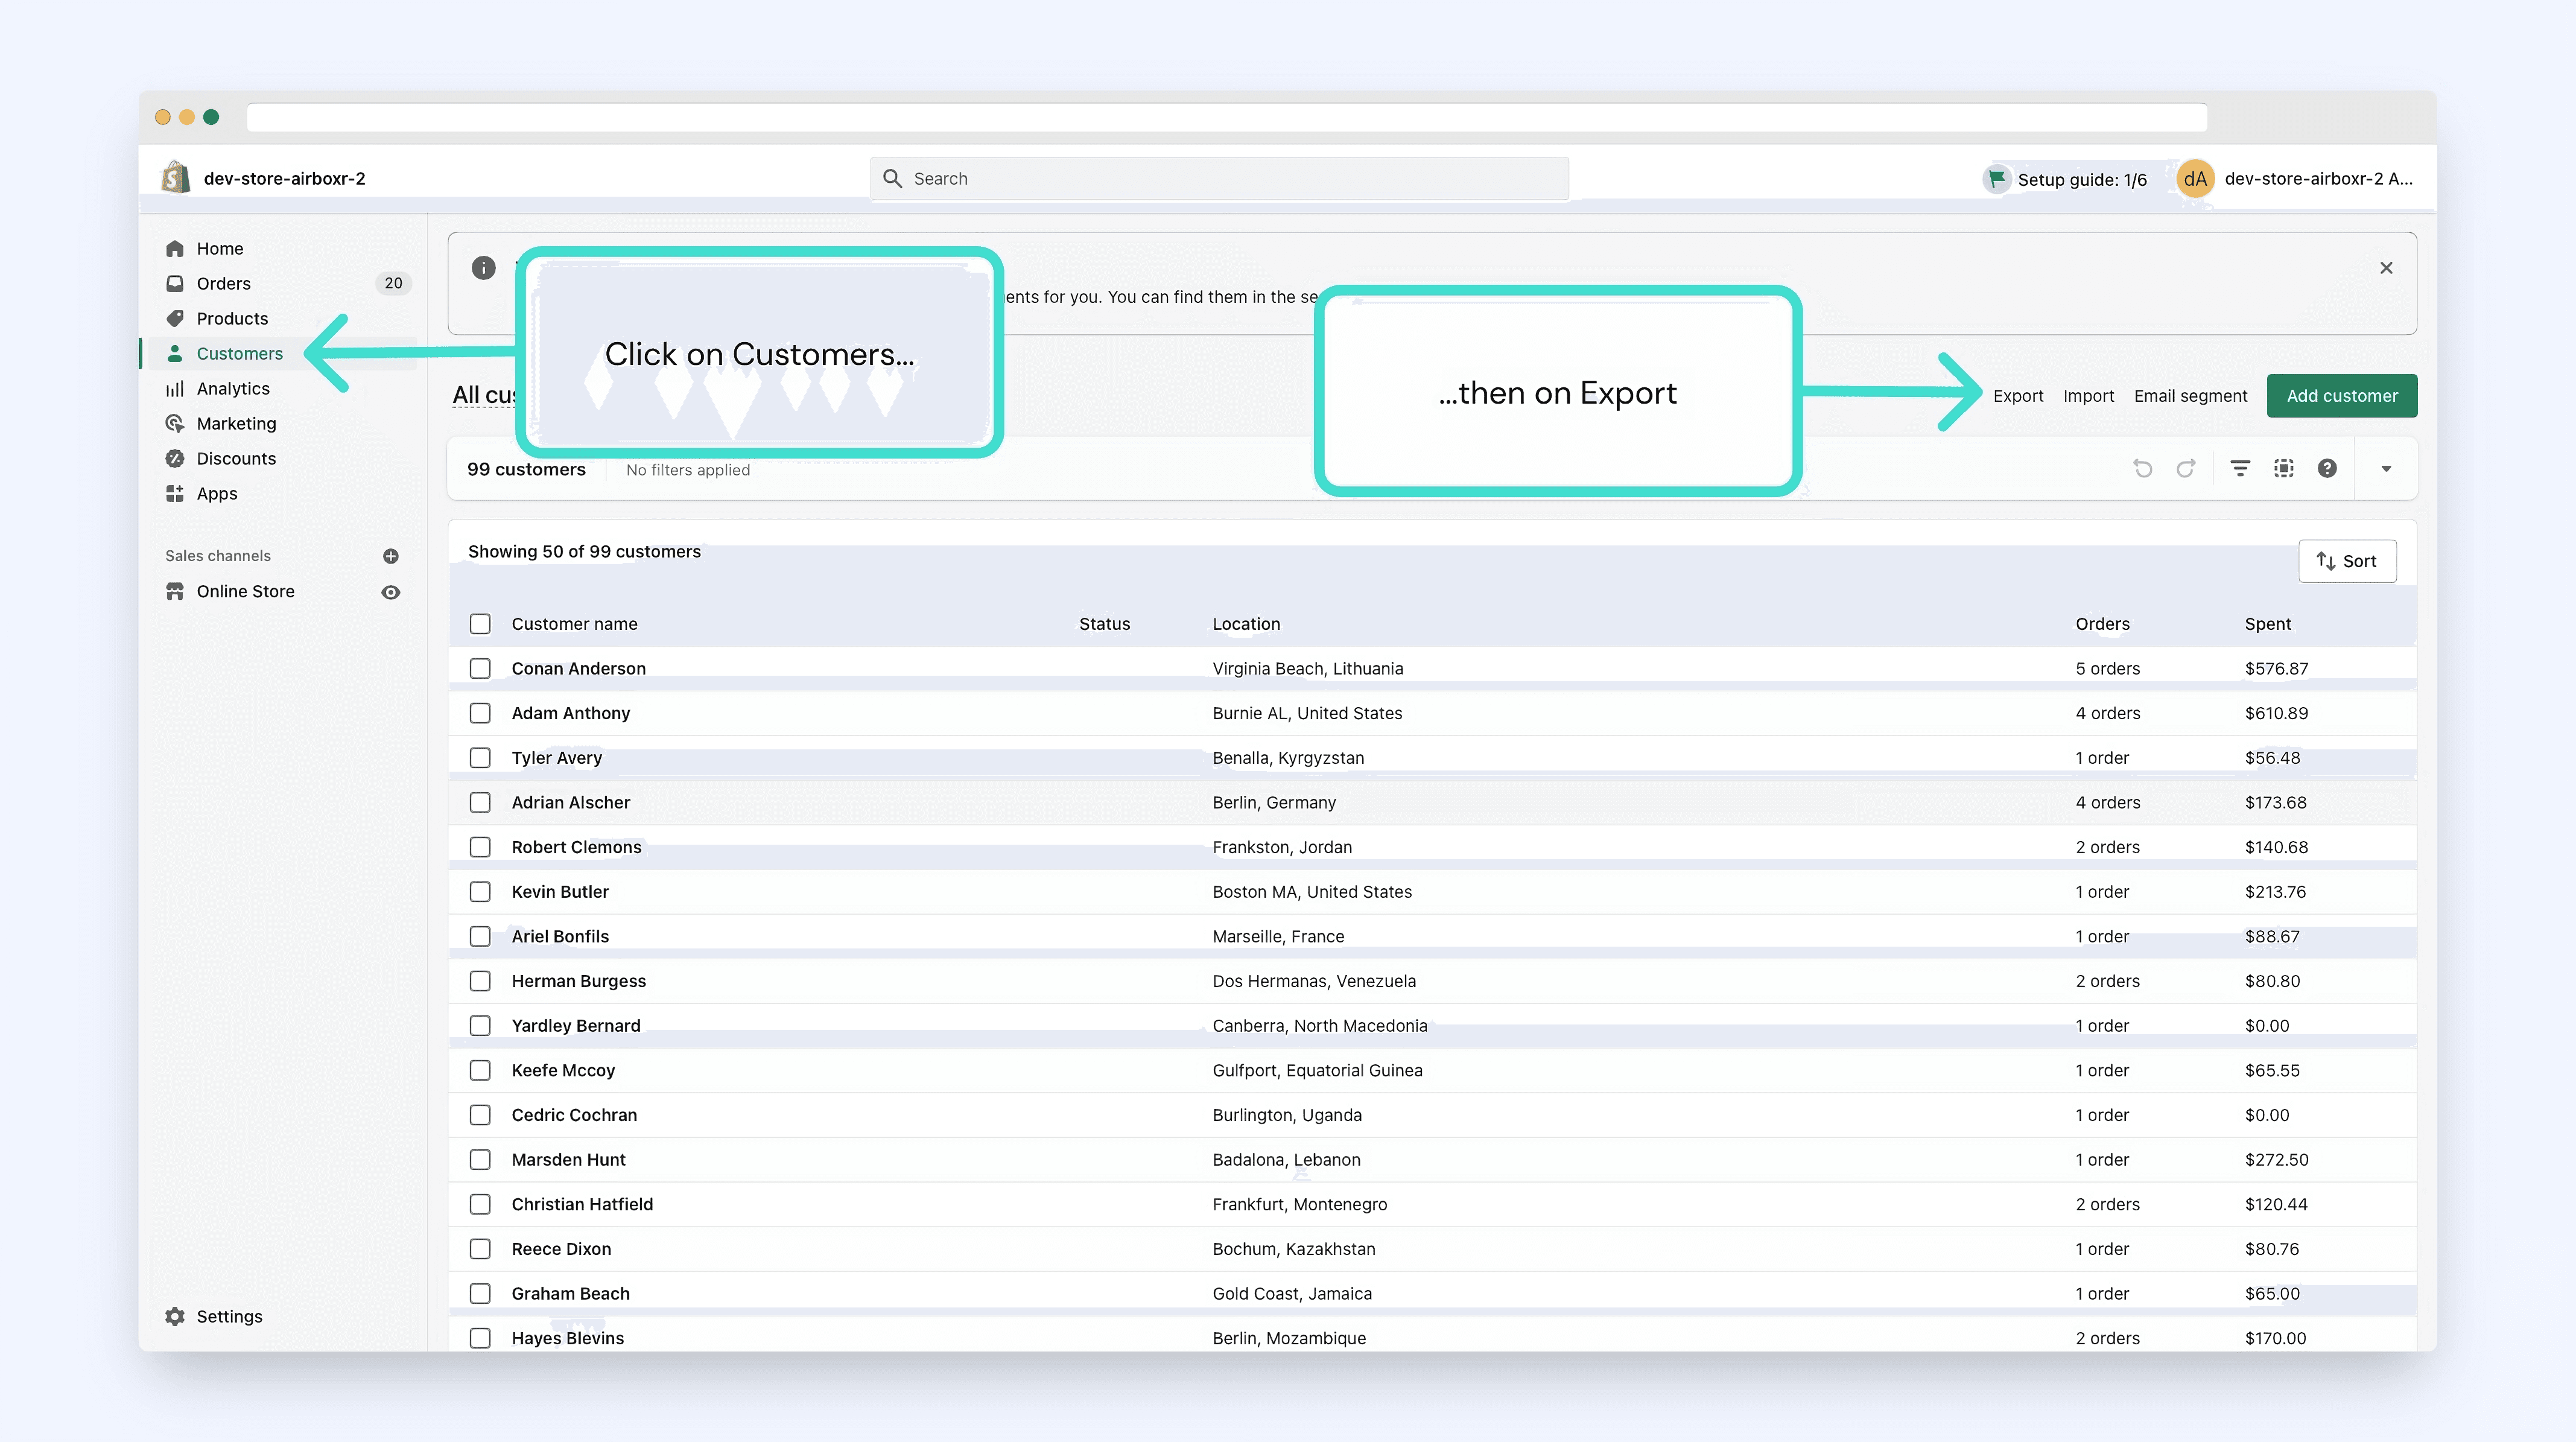
Next, we will download the customers. Click on Customers on the left navigation, then click on the Export button. A pop-up will ask you if you wish to download all customers or just those on the page—select the option to download all customers.
Step 3: Combine the data into a Google Sheet
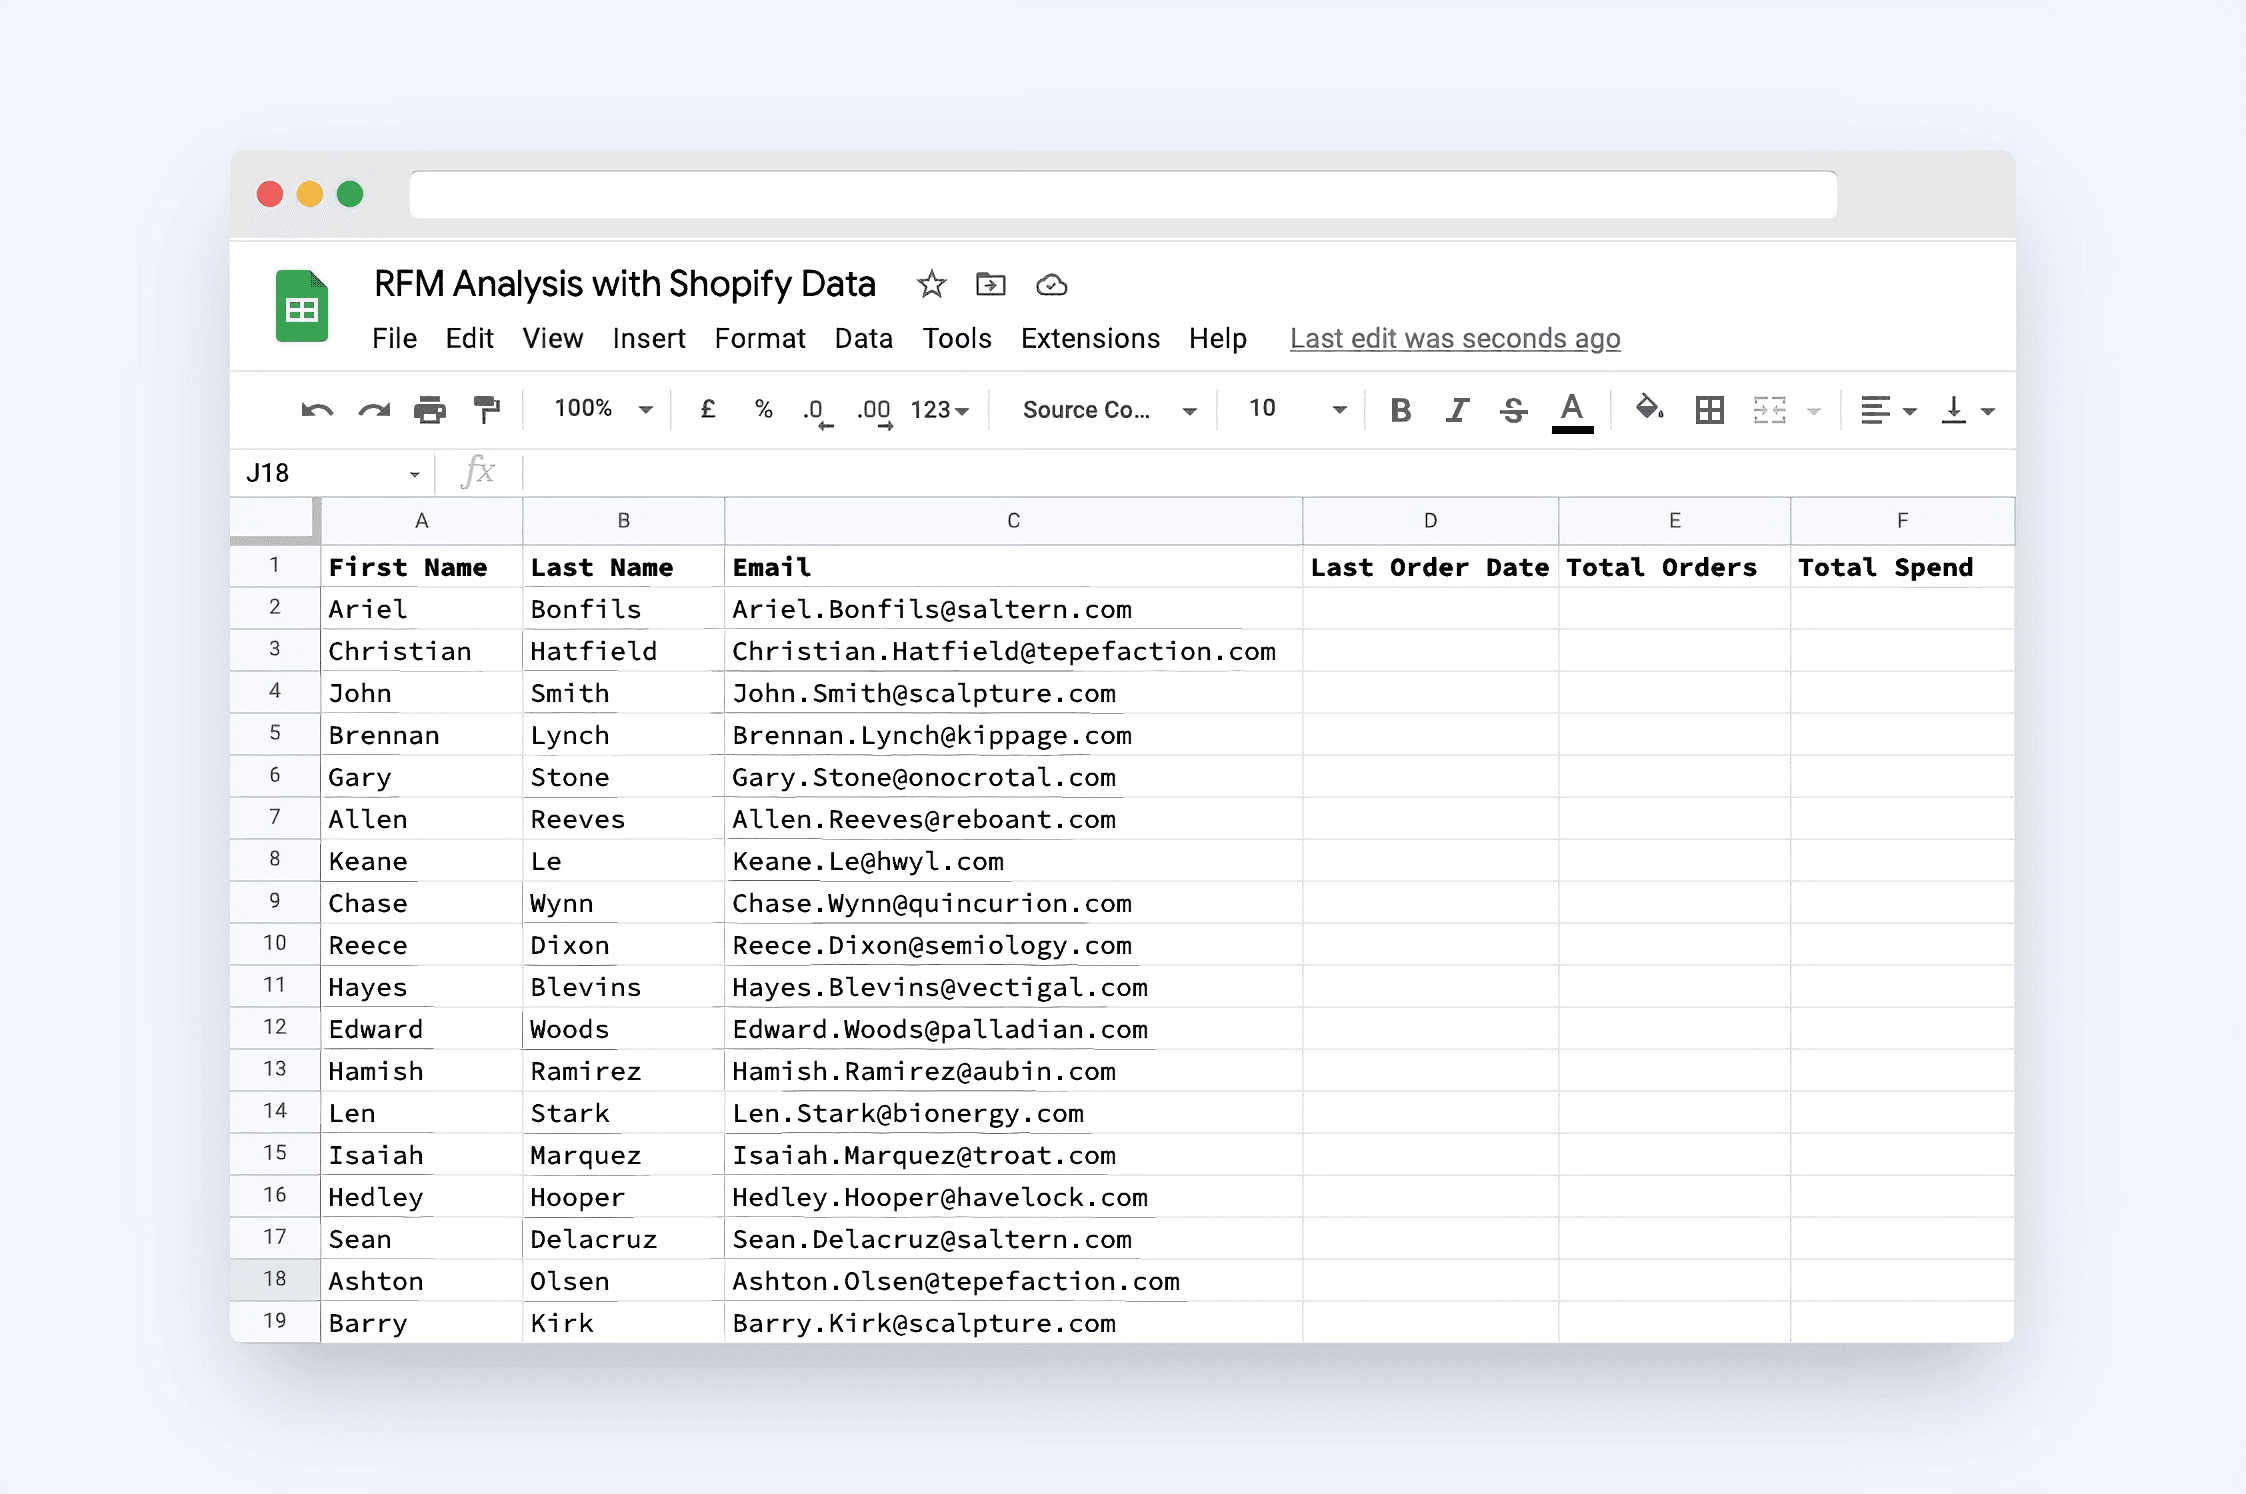
Now, we will populate the sheet you see below. We already have the columns A, B, C, E, and F from the export on Step 2. We will run a vlookup formula from the orders sheet you’ve downloaded:
=vlookup(C2, Orders!B:P, 15, false)
Step 4: Allocate scores for RFM
Next, we will divide the values in D, E, and F into five quintiles and give them a score.
Quintiles are any of five equal groups into which a population can be divided according to the distribution of values of a particular variable.
First, remove all customers whose Total Orders is 0. It’s unlikely they are going to be our most valuable customers.
We will now format column B correctly—let’s use the Split Text to Columns option to extract out the date. Here’s a quick video.
Let’s now add three new columns called R, F, and M. We will allocate each customer a score between 1 and 5 depending on the values of Last Order Date, Total Orders, and Total Spend respectively. 5 is the best and 1 is worst.
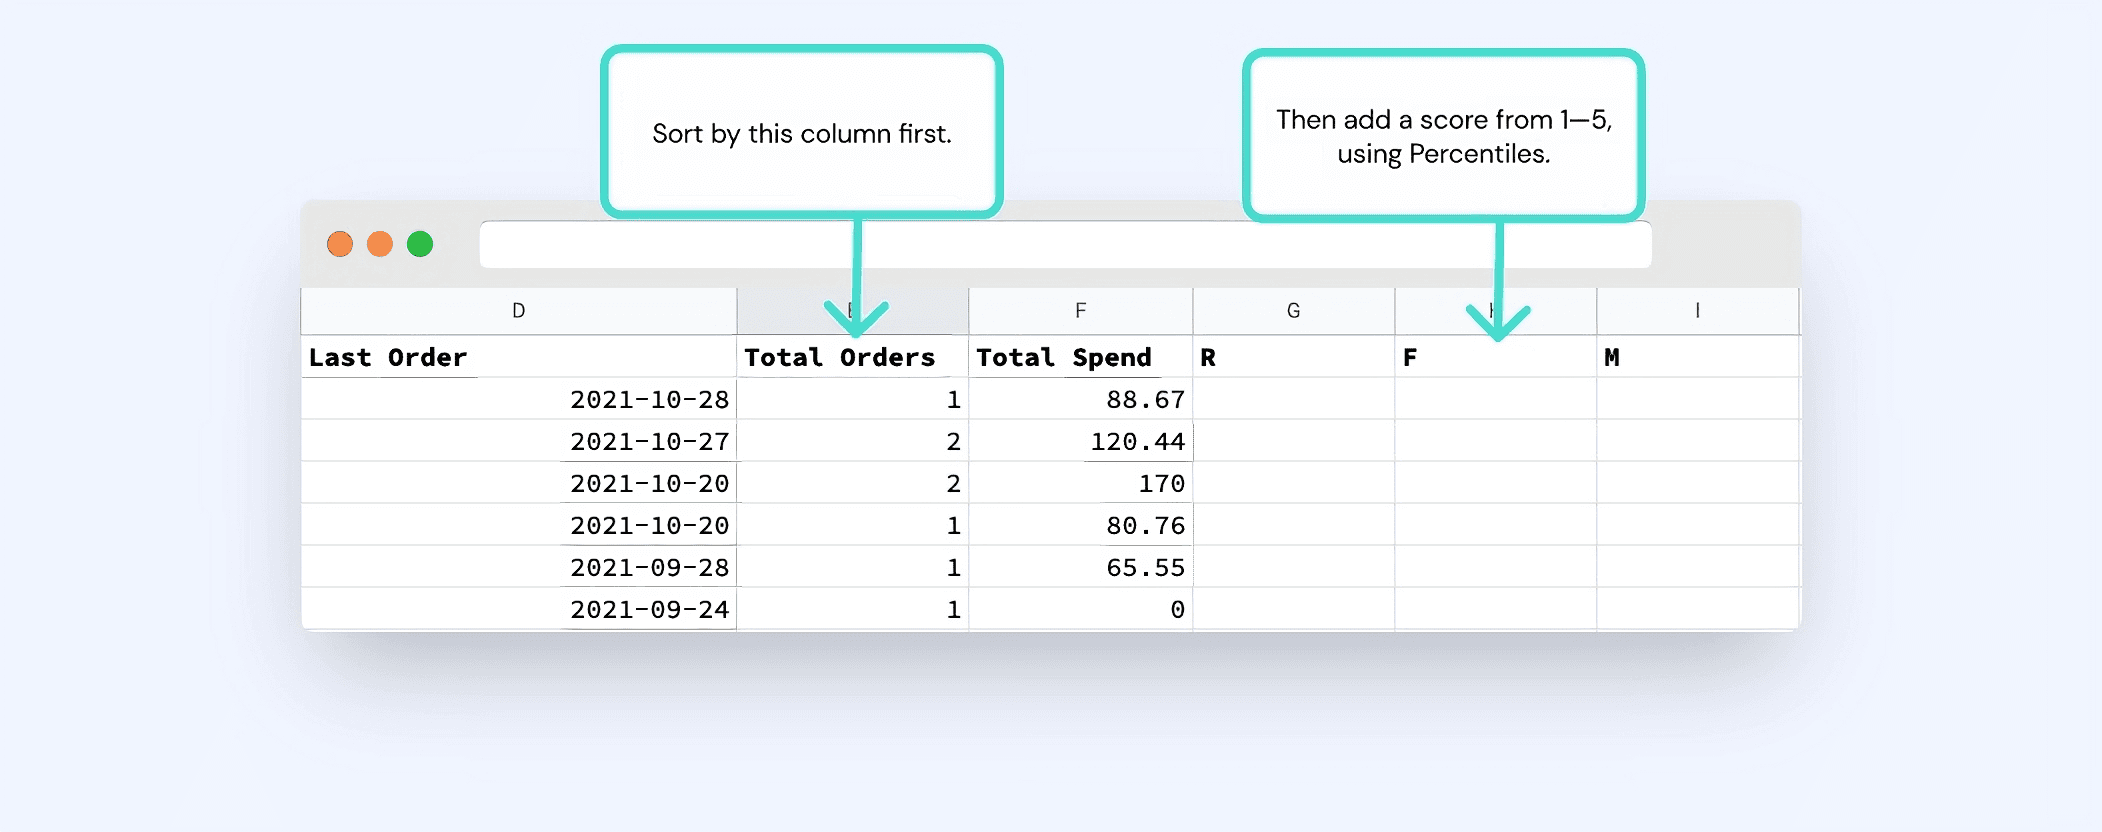
To allocate scores, we use the PERCENTILE formula to identify what the cut offs should be. Here is how the percentile formula works: first we find the 0th, 20th, 40th, 60th, and 80th percentiles for each of the columns. The video explains how.
Now, give a score of 1—5 for each of R, F, and M using this criteria:
Between 0 and 0.2 quintile = 1
Between 0.2 and 0.4 = 2
Between 0.4 and 0.6 = 3
Between 0.6 and 0.8 = 4
Greater than 0.8 = 5
That’s it!
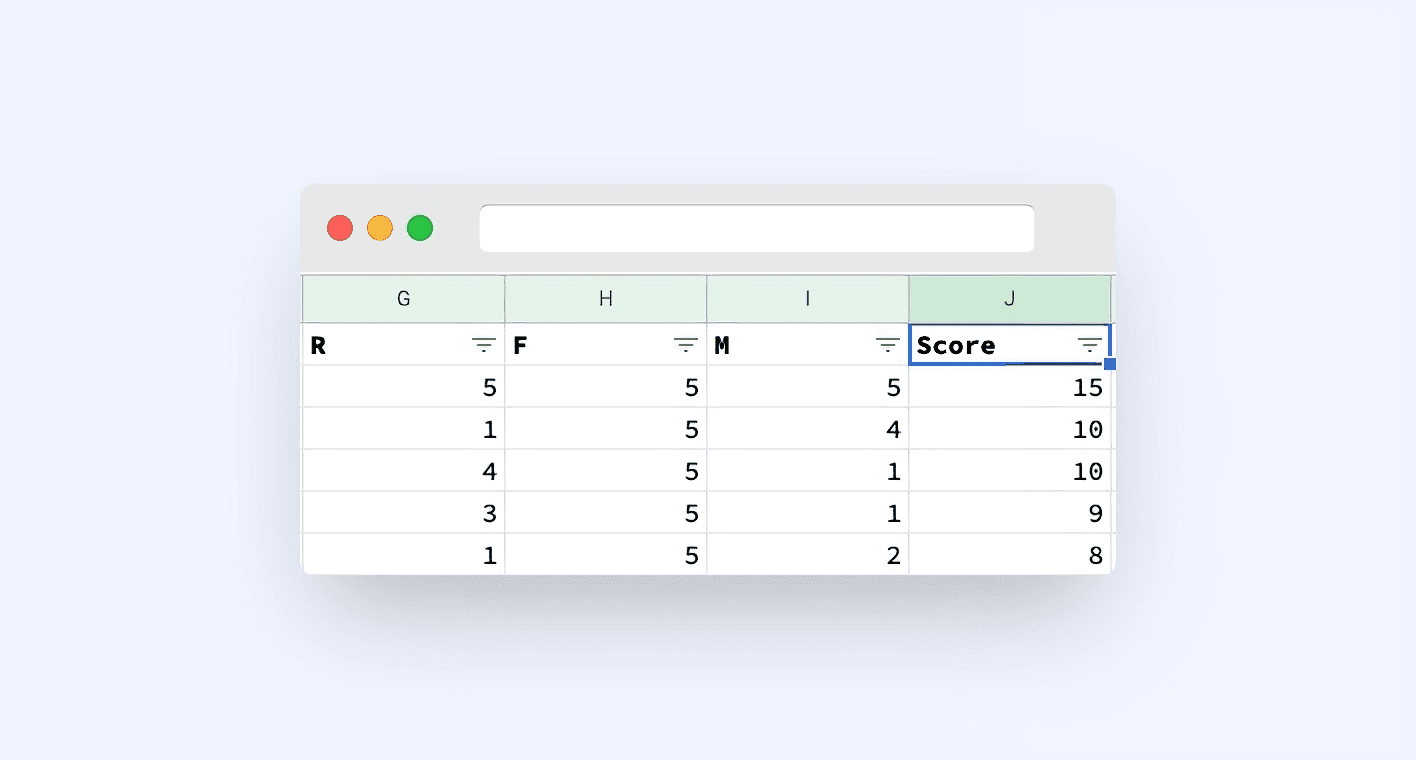
You should finally arrive at a sheet that looks like this. On the last column (J), sum up the RFM scores to arrive at the final score for each customer. Sort all your customers by this score to find your most valuable customers!
Improve your DTC game. Sign up for weekly tips.
Option B: With a single click using Airboxr
How to run an RFM analysis on Google Sheets with a single click?
While the steps are great to understand how to conduct an RFM analysis, but there are still a lot of steps involved. If your store is on Shopify, you could run the entire analysis with a single click using Airboxr.
Here is a sneak peek into how easy it is to do an RFM analysis (Most Valuable Customers) with Airboxr.
If you haven't tried Airboxr yet, enter you work e-mail below to start your free trial.
