Reporting & Analysis
05.12.2021
TLDR
Airboxr can help you leverage Google Analytics data to make data-driven decisions for your business. You can use it to analyze visitor statistics, track referral performance and traffic, make sense of goal conversion rates, and evaluate your traffic sources. By using Airboxr's templates and Google Analytics metrics, you can gain valuable insights into your website's performance, including the number of users, sessions, goal conversions, and more.
Google Analytics is an incredibly powerful resource, tracking tons of metrics that can be used to draw insights on your business and how users are interacting with your product. With Airboxr, you will be able to draw upon these insights to gain a clearer picture of how well your site is helping you reach your performance goals, and the strategies that you should employ to help you attain them. In this article, I will go through some ways you can use Airboxr to pull key metrics to help with your decision-making.
Analyze Visitor Statistics
A key facet of understanding just how well your business site is doing in attracting customers is by quantifying the amount of visitors and traffic to your site. These metrics include the number of users that visit your site or the number of user and bounce sessions generated, all of which should give you an idea of how well your website is doing at attracting new users, and also how good it is at retaining customer's interest after your customers visit your page.
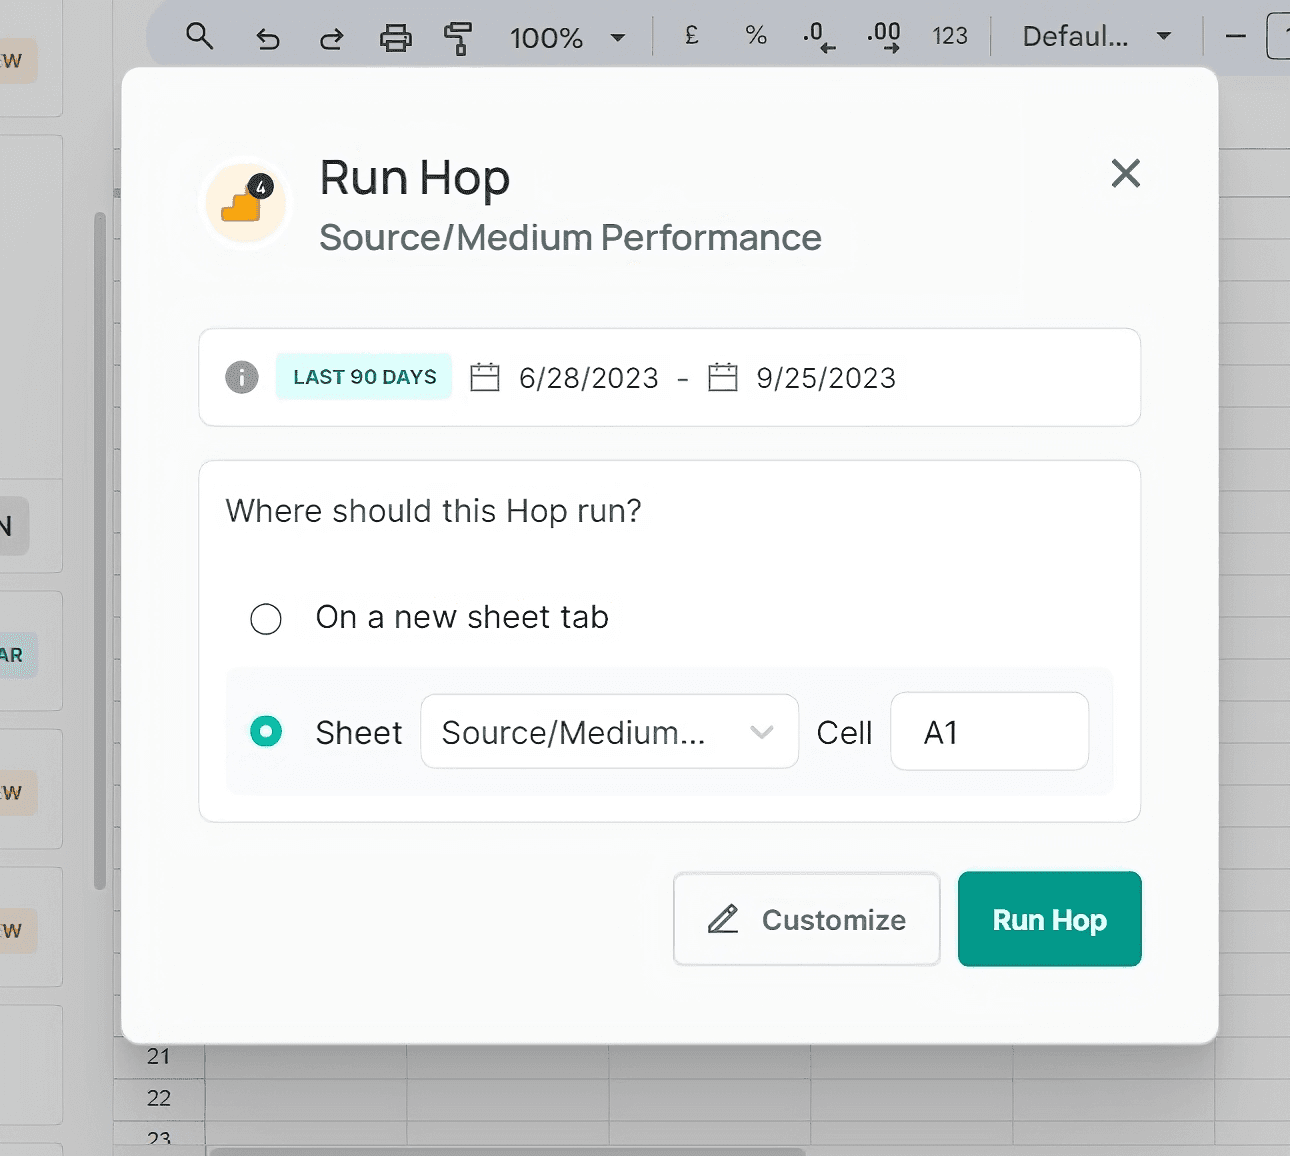
With Airboxr's Source/Medium Performance Hop, you will be able to do just that and track the following Google Analytics metrics:
Number of Users: How many users visited your website over the specified time period?
Number of Sessions: How many new sessions were created by users on your website over the specified time period?
Number of Engaged Sessions: Total sessions with user interaction.
Average Engagement Time per Session: Average time users actively engage.
Engaged Sessions per User: Avg. sessions per user with engagement.
Events per Session: Avg. user interactions per session.
Engagement Rate: % of engaged sessions vs. total sessions.
Event Count: Total recorded user interactions.
Conversions (All): Total number of conversions on your website or app. Conversions can be any predefined goals or actions that you want users to complete, such as signing up for a newsletter or making a purchase.
Conversions (Purchases): Number of sessions that resulted in a purchase conversion.
Total Purchases: Raw count of all purchases.
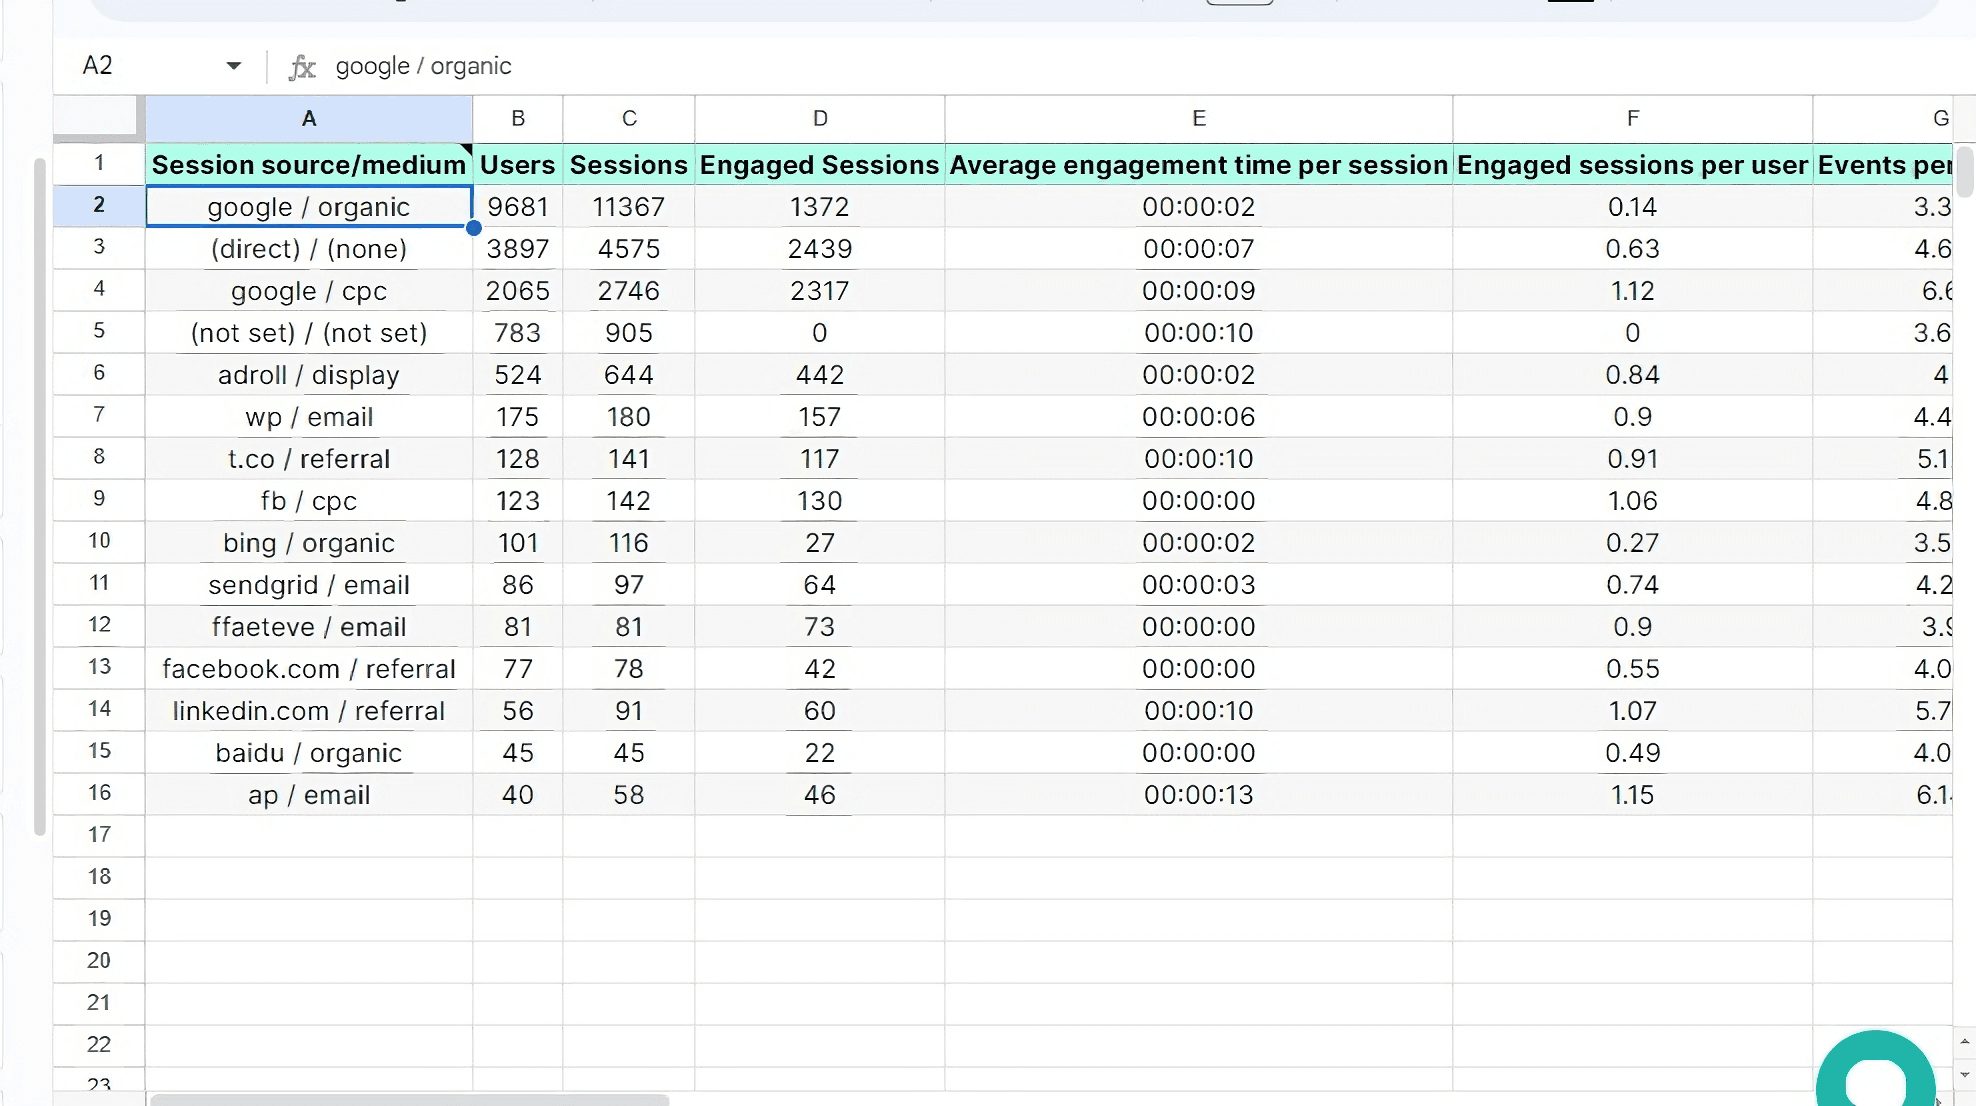
You could even combine these metrics easily to deduce secondary metrics such as the number of sessions per user to give you a clearer idea of how well your customers are engaging with your website.
Analyze Referral Performance and Traffic
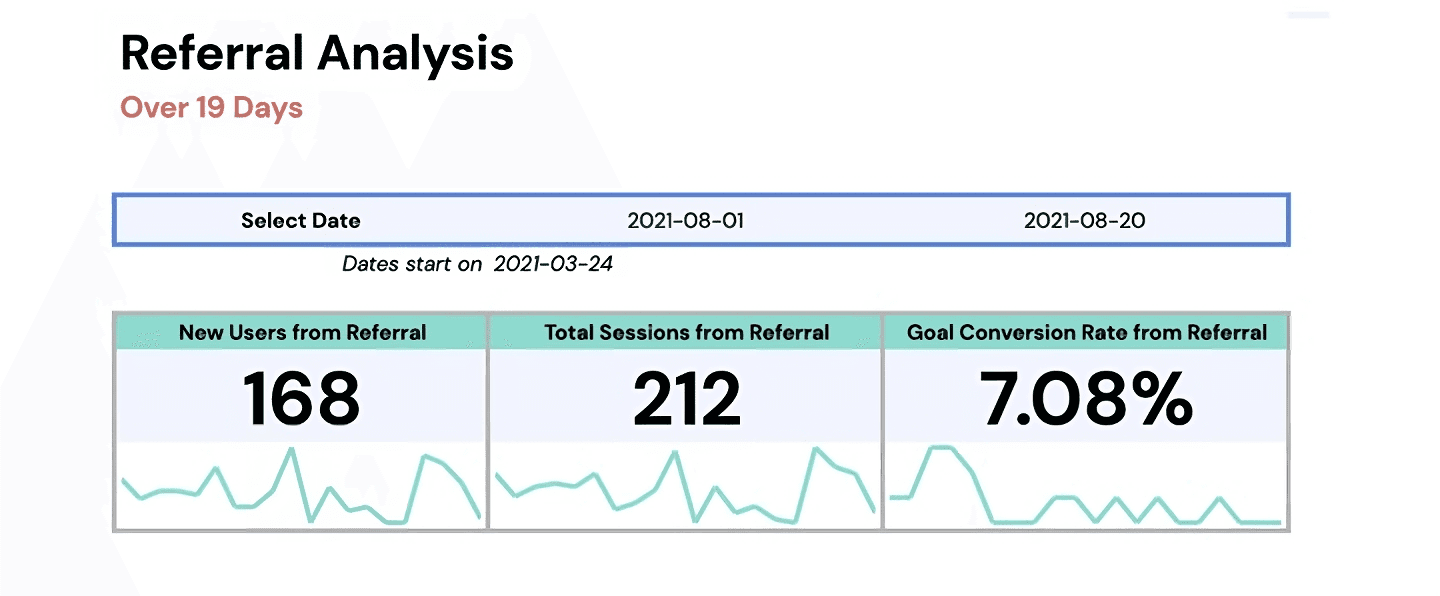
Referrals are often a great medium for attracting new customers bases to your product. Suppose you wanted to specify your analysis of user traffic to your website only to users who visited after referrals, so as to evaluate the effectiveness of referral campaigns or marketing strategies. Analyzing referral performance metrics like the number of new users you receive through referrals, or the number of sessions generated by users from referrals can give you a clear sense of how well your referral campaigns are performing, and whether or not they deserve your continued investment. Some of these metrics include the following:
New Users from Referral: How many new customers visited your site after being referred to it?
Total Sessions from Referral: How many new interaction sessions were generated on your site from referred users?
Goal Conversion Rates from Referral: Out of all the sessions generated from referrals, what percentage was able to successfully convert / achieve a specified business goal?
Note: What is specified as a goal can be customized depending on the specific performance targets your business is trying to achieve.
Airboxr's Referral Analysis template will allow you to perform these evaluations, tracking Google Analytics metrics pertaining to user traffic, sessions and goal conversions generated from referrals. This template also aggregates the above metrics to provide you with a list of the top referral domains for your website - i.e. the referral sources that direct the most user traffic, generate the most interaction sessions and are most successful at converting users to attain your business goals. With these insights, you will be able to evaluate the success of your referral campaigns, and also identify the referral sources that most effectively facilitate the pursuit of your performance goals!
Make Sense of Goal Conversion Rates
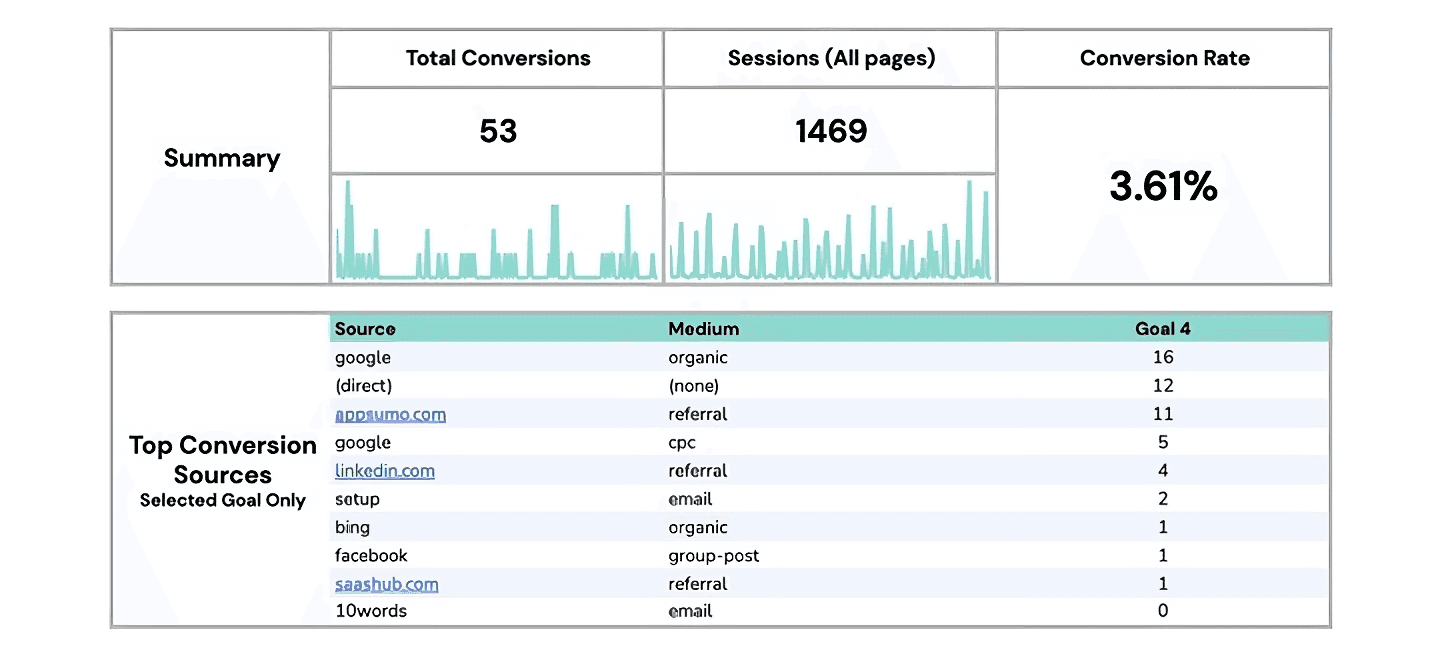
Google Analytics' goal conversion metrics help you track whether users did a specific action on your website that you are actively tracking for. For example, if you were an e-commerce brand, you would track the number of users who successfully made a purchase. These customizable metrics help you tell whether your website is well-aligned with your key performance targets, or whether it is detrimental to your company's goals. Some metrics that fall under this category include:
Total Number of Goal Conversions: Among users across the entire website, how many successful goal completions were achieved?
Overall Goal Conversion Rates: What percentage of all your user sessions resulted in a successful goal conversion?
Top Goal Convertors (by Source / Medium): Which specific sources or mediums performed the best in converting your users?
With Airboxr's Conversion Dashboard, you will be able to tell at a glance just how well the current version of your site is doing at converting users and achieving your business goals by tracking the above metrics. With this dashboard, you will be able to find your top conversion sources and monitor your overall goal conversion rates with just a single click! Figure out how your conversion rates respond to different campaigns and strategies, or which sources to focus on to most effectively increase user conversions.
Improve your DTC game. Sign up for weekly tips.
Evaluate your Traffic Sources
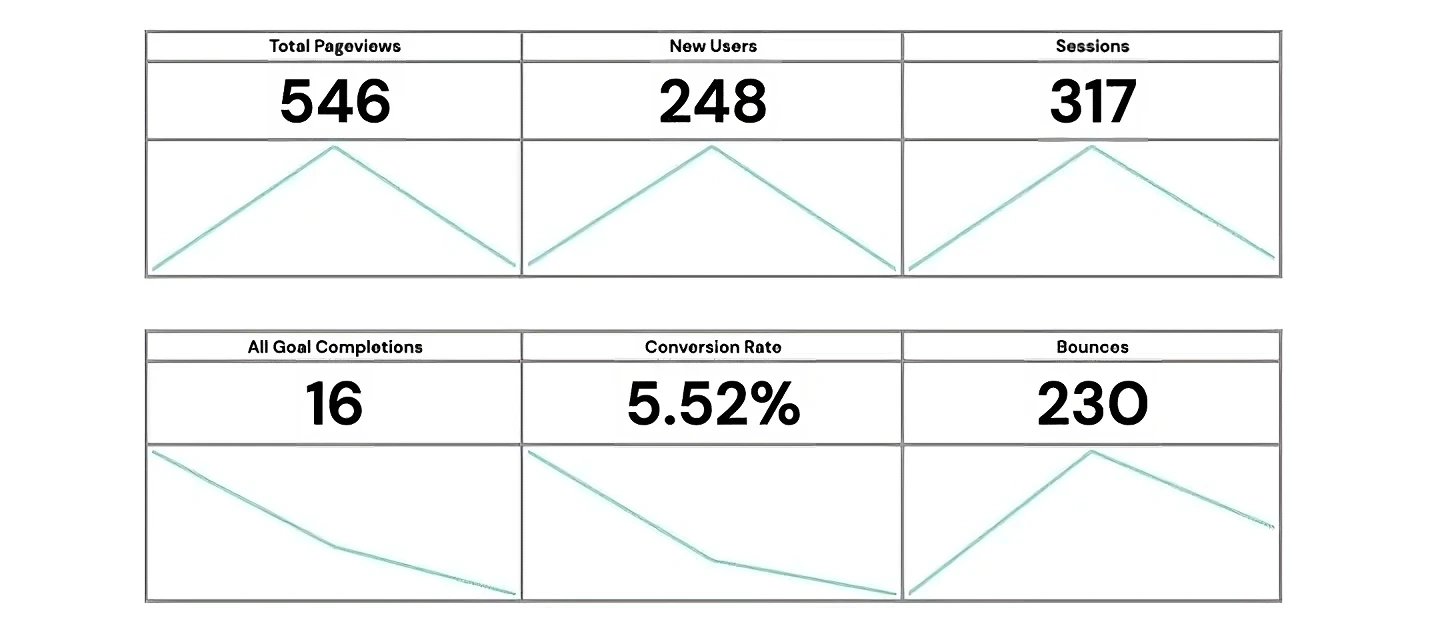
Every business has limited resources, which makes it important to accurately determine which traffic sources or mediums constitute the best use of your resources, in terms of their effectiveness in generating returns for your business. This data can help you formulate new strategies that capitalize on sources that statistically generate the most value for your business, and ensure your resources are maximized in your pursuit of your performance targets! Some key metrics used to determine the quality of your sources include:
Total Pageviews by Source: How many new pageviews came from users from a particular source?
New Users by Source: How many new users were brought to your website from a particular source?
Total Sessions by Source: How many interaction sessions did each source generate over a period of time?
Goal Completions by Source: How many successful goal completions did each source generate?
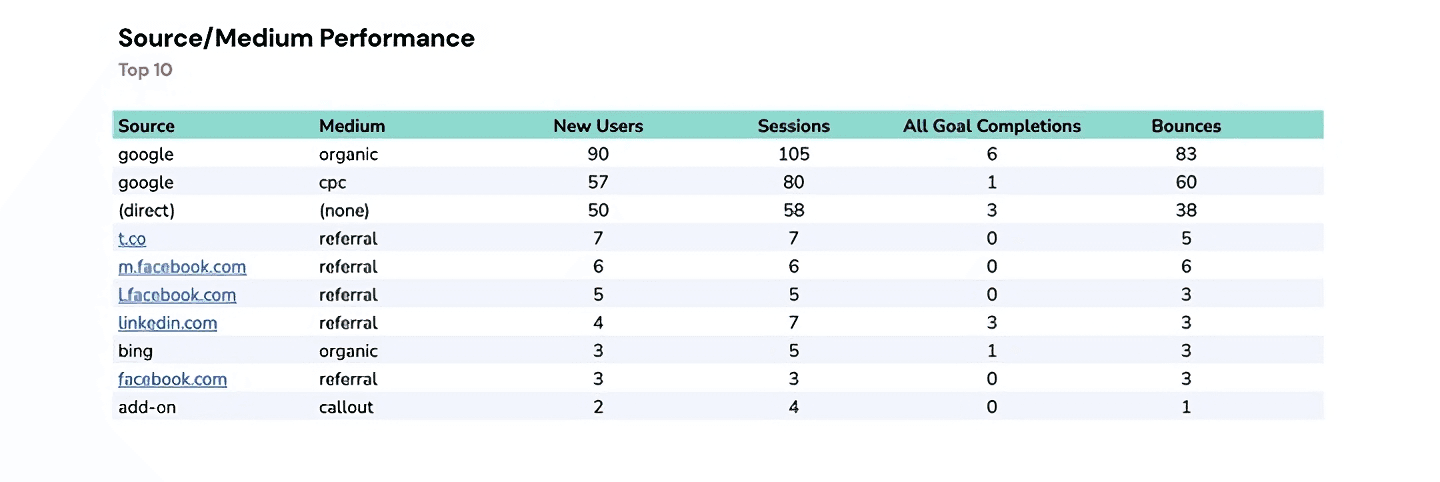
Track these performance metrics with Airboxr's Source / Medium Performance template. With the template, you will be able to understand where your most meaningful user traffic is coming from, and which sources and mediums are driving the most growth for your business.
In all, I hope this blog post has shown you the power of Airboxr and Google Analytics in helping you make data-driven decisions for your business. These are just a few ways of using Airboxr with your Google Analytics metrics to boost your business's performance with just one click! I hope you try out some of these techniques for yourself soon, and do let us know what other templates you'd like to see for your Google Analytics data!
Sean Lim
About the Author
