Reporting & Analysis
14.10.2022
TLDR
To effectively monitor your online store's Black Friday performance, set up a comprehensive sales report in Google Sheets using Airboxr. Customize the report with relevant metrics and Hops based on your campaign period and priorities. Begin with the Gross Sales Hop, schedule it to run daily, and analyze daily deals' effectiveness, hottest selling products, sales by product category, stock availability, and payment methods. Additionally, consider using Hops like Orders and Coupon Code Performance to gain insights into your store's performance, ensuring an organized view of your sales and product data during the hectic Black Friday shopping period.
Every year, stores get creative with their Black Friday sales and Cyber Monday deals, often creating an online shopping extravaganza to rival or sometimes complement an in person shopping experience. Of course, with all that effort put into customer engagement, it's crucial to be able to monitor sales. Some companies may be searching for the best Black Friday apps to help alleviate the holiday season crunch—Shopify just released a list of 25 helpful apps. But there must also be a way of reviewing the effectiveness of all these apps on your sales numbers, and we don't mean just looking at the big number on your Shopify dashboard.
An excellent way to monitor your online store's performance during Black Friday is to pull the sales reports into Google Sheets. Why is this so? The reason is that Shopify often gives you reports which are important, but may not be specific enough to be actionable. At times, certain specific reports are difficult to customize in the Shopify admin, and some reports are not even available for their lower tier plans.
Today, we'll show you how to create a sales report in your Google Sheets that gives you an excellent view into the important metrics to keep track of for your online store. You will be able to get insights into specific queries that should be top of mind for any online store during the holiday shopping season. These are the topics we'll cover:
Let's get into it.
How to set up your online store sales report with Airboxr
Before setting up your online store sales report, you need to keep in mind:
Duration of your Black Friday Cyber Monday campaign period
What kinds of metrics are most important for you to track
These will determine the time frames for your reports, as well as which automated reports—or Hops—you would choose. We will offer all the relevant Hops in our article, but not all of them may be necessary for you. Feel free to pick and choose as you require.
Once you have that figured out, setting up your spreadsheet is easy and can be done in 3 steps:
Step One: Run your first Hop on a new spreadsheet
Choose any Hop and run it on a new spreadsheet. We suggest the Gross Sales Hop.
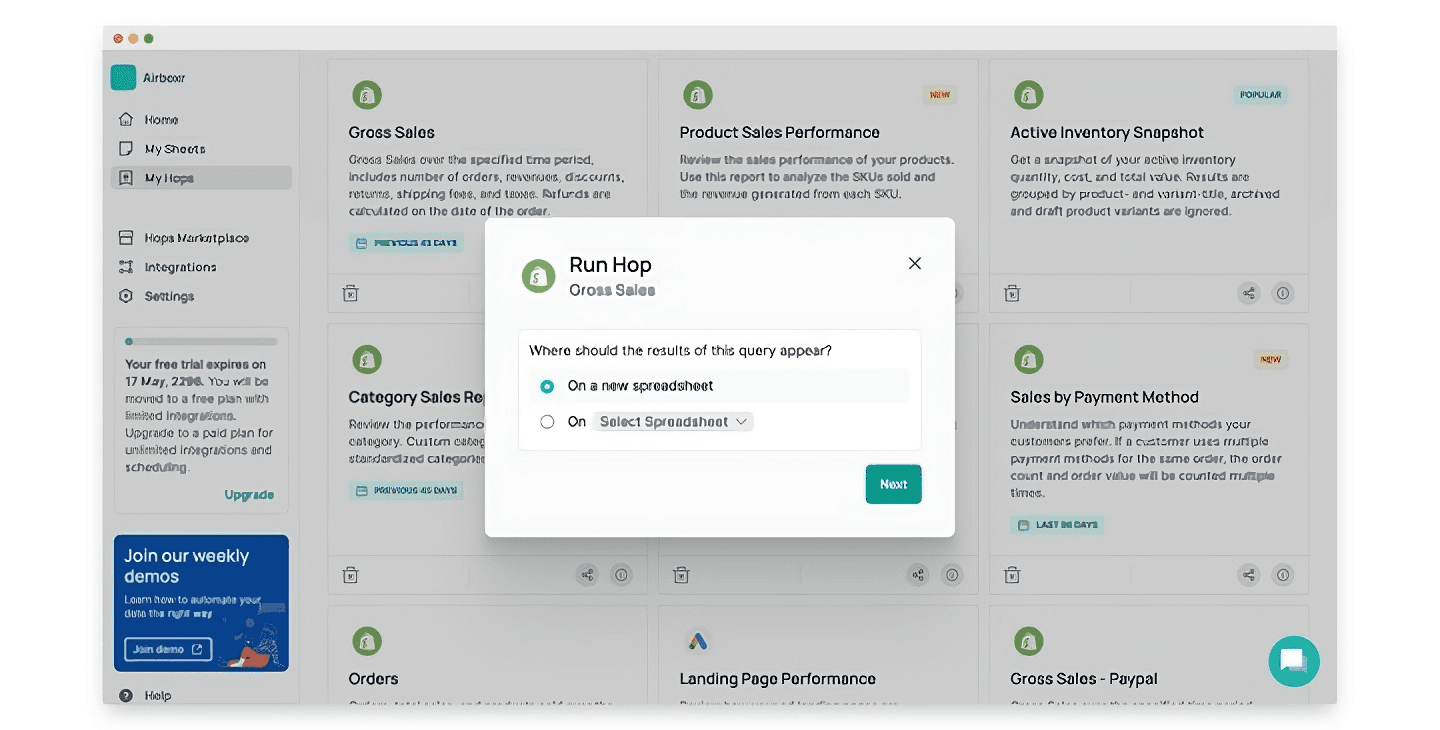
Step Two: Schedule the Hop
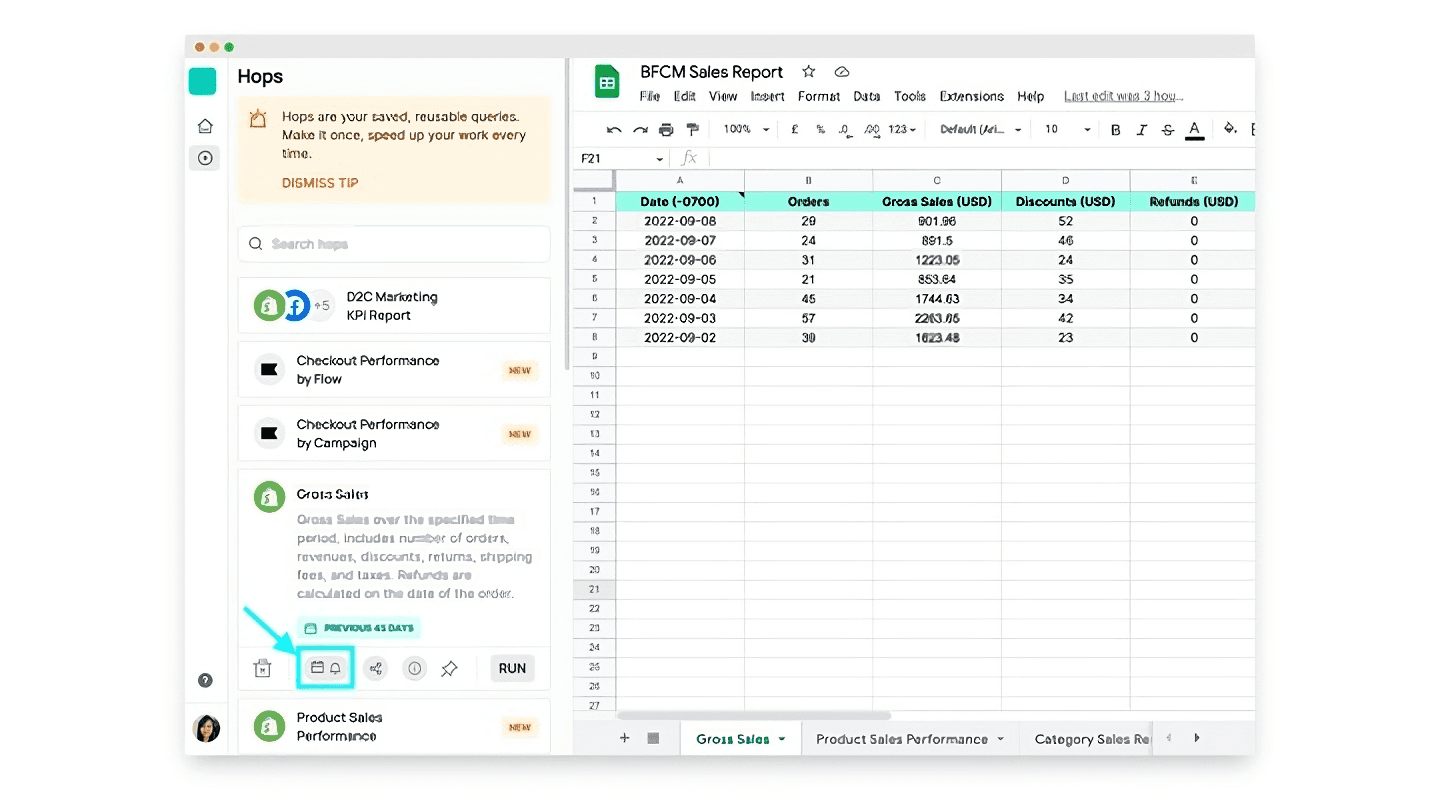
Once the Hop has run, schedule it to run at regular intervals - we suggest daily, so you get a fresh report every morning before your work day. Click on the Schedule button highlighted in the screenshot below.
You can also watch a video walkthrough for scheduling a Hop.
Step Three: Run other Hops in new tabs in the same spreadsheet and schedule them
Now that you have your spreadsheet prepared with the first Hop scheduled, all you have to do is repeat the process for any other Hops you may want. If you have already added your relevant Hops from the Hops Marketplace, you can find them in your sidebar. If not, you can simply search for the names and they will show up for you to add directly to My Hops from within the sidebar itself.
The screenshot below shows where you can find your Hops. We suggest running the Product Sales Performance Hop, and will suggest more Hops to add below.

Now that your report is all set up, we'll show you how you can get the most important insights from them.
How to review the effectiveness of daily deals
Some online stores offer deep discounts during sale periods like BFCM, and some only offer their best deals on certain days. Given how intense the sales period can get, it's important for e-commerce managers to be able to identify daily gross sales figures which reflect the daily deals offered by the shop, so that the decision makers can consider if their current offers are working to attract sales, or if they should put up new deals for the next sale period.
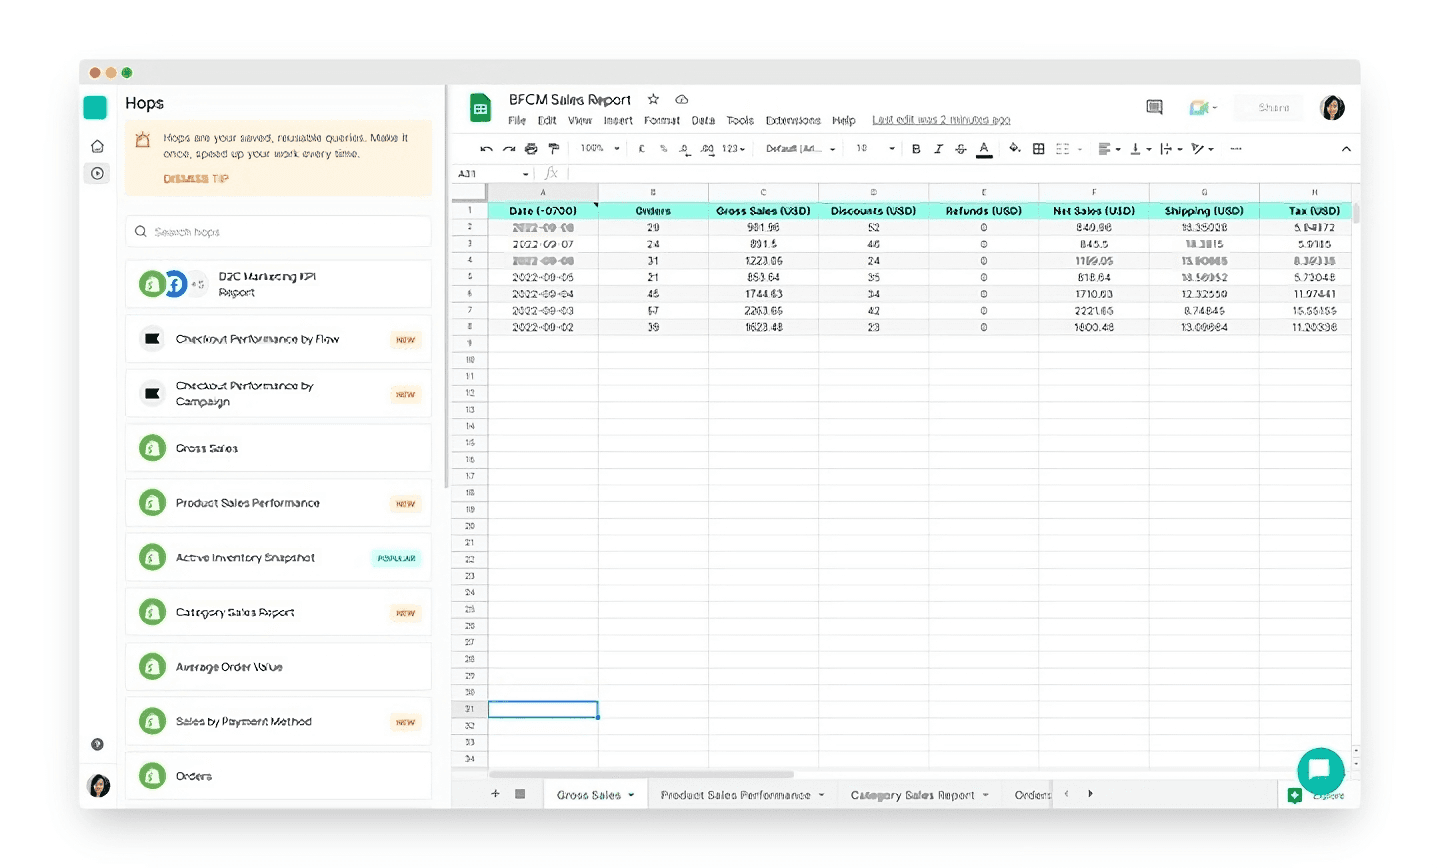
If you're running different deals on a daily basis, a great way to review them would be the Gross Sales Hop. This report shows daily sales figures, including total orders, gross sales, total discounts, total refunds (attributed to the day of purchase), net sales, shipping fees, tax, and total sales.
You can run the Gross Sales Hop for a week, or however long your BFCM campaign period is. Here's how it would look like in your Google Sheet:
How to identify the hottest selling products on sale days
Keeping track of product movement is essential during sale periods. Knowing which particular product sells most quickly, for example, can help to inform your overall marketing strategy to fuel future potential purchases. That's why you need to be on top of your product sales performance.
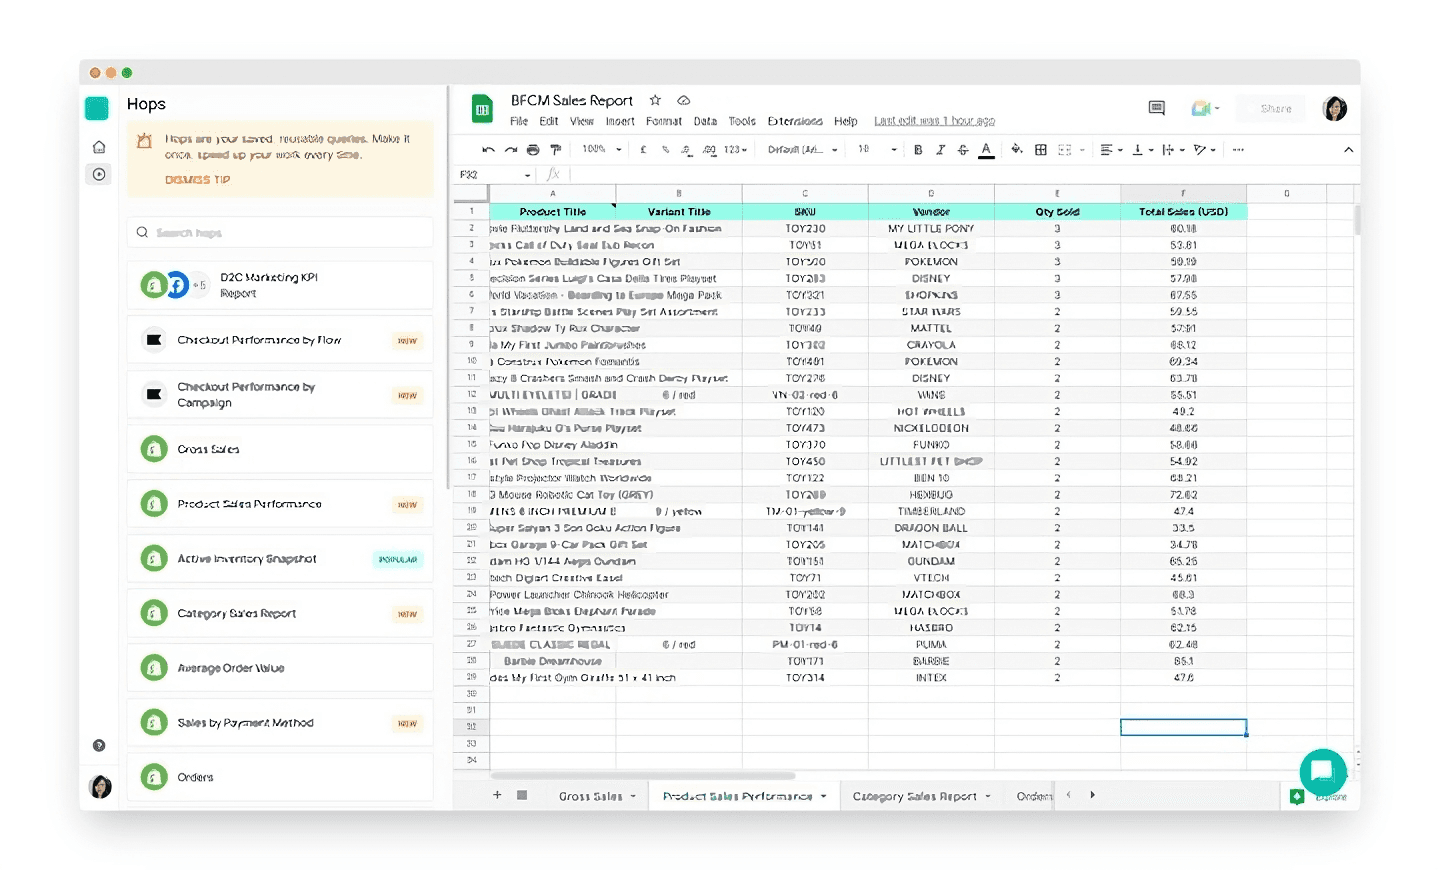
To do this, run the Product Sales Performance Hop on a daily basis. This is how the report would look:
How to review Shopify sales by product category
If you're a category manager, you'll want to know which categories of products are most popular in your store. Often, shoppers maximize their delivery fees or try to hit free shipping by adding on small items to their cart, even if they initially only had one main item on their shopping list. Having an overview of your total sales by category gives you a good sense of the ratio of how many of these add-on products tend to be bought in relation to the main products.
Insights like these help not only with future purchasing and sourcing, but also for expanding into new product categories.
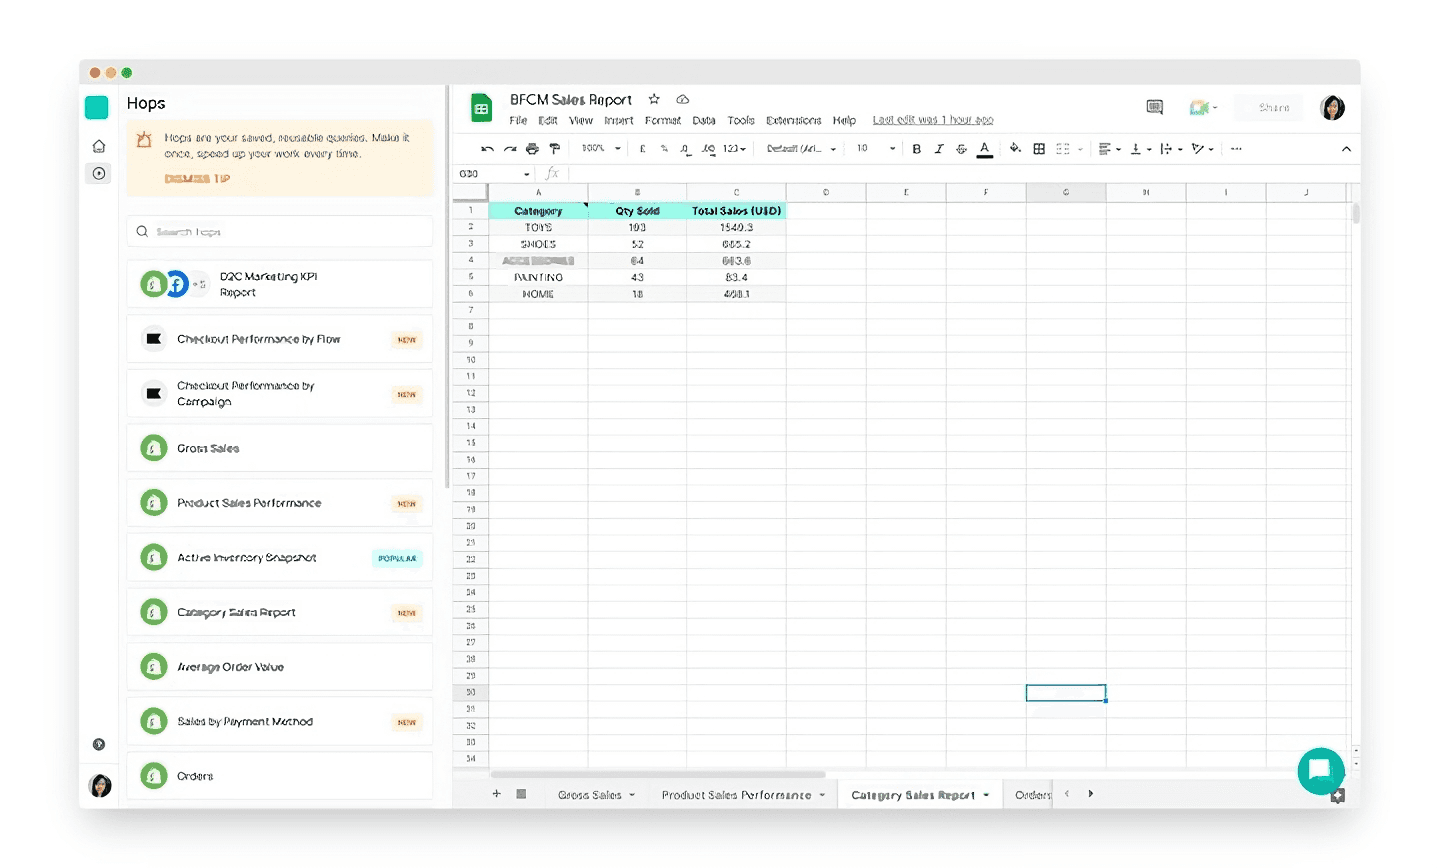
The Category Sales Report is useful for this. Here's how it looks:
Improve your DTC game. Sign up for weekly tips.
How to check availability of stocks and prevent shortages for your Shopify store
One thing you don't want to miss out on is inventory management. With all the ongoing Black Friday deals, products tend to fly off the shelves faster than usual. You'll want a snapshot of your inventory at any given time.
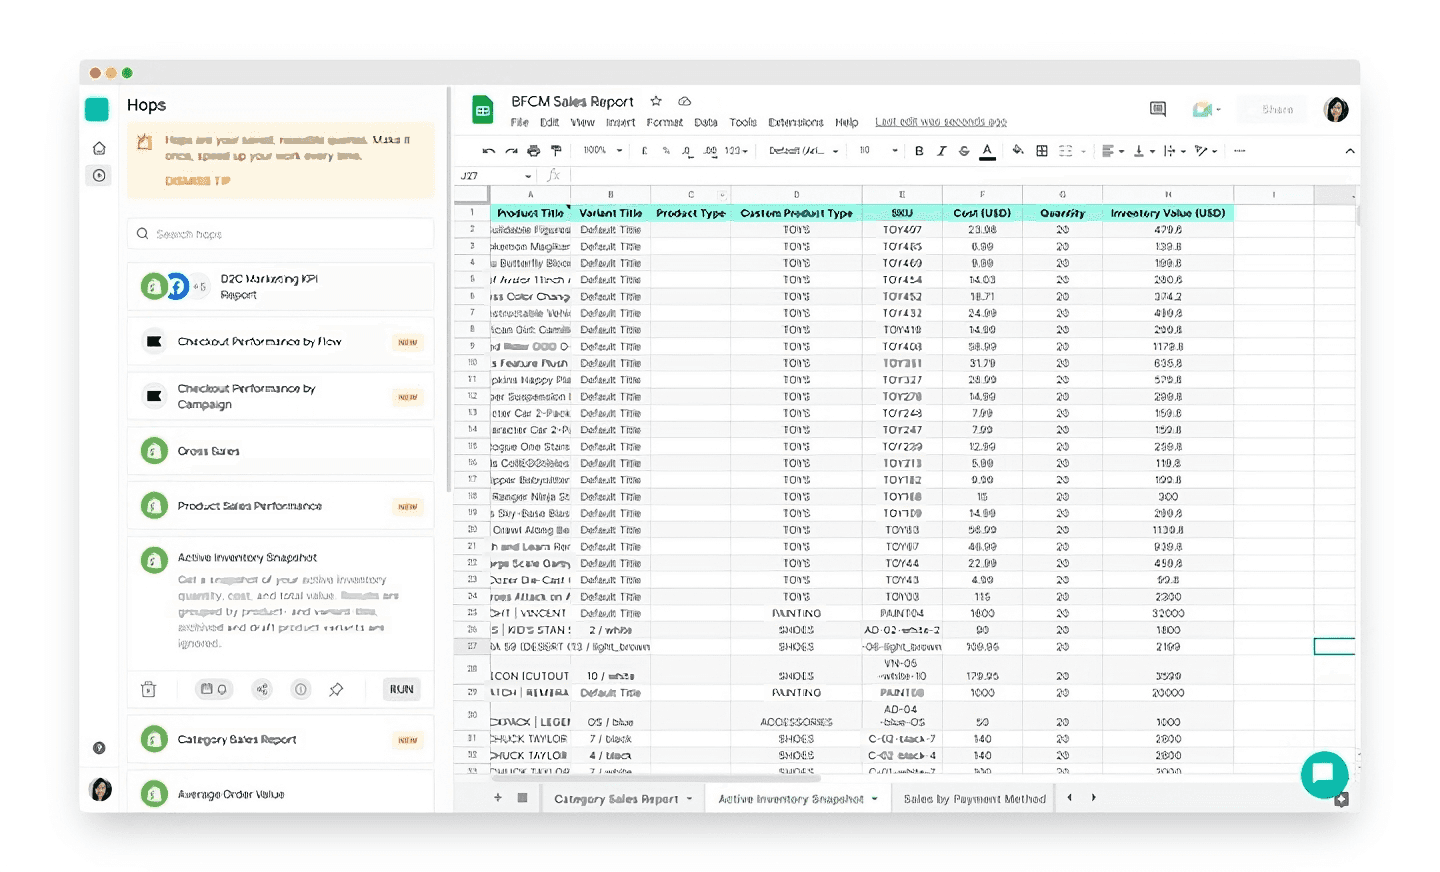
For this, run the Active Inventory Snapshot Hop. This gives you a quick look at all the inventory currently in your store, hence there is no need to select a timeframe. If you want to know exactly when it was run, click on Cell A1 in your spreadsheet and you'll see a note with the import details. This is how it looks:
How to view daily sales on Shopify by payment method
At the end of the day when you tally your finances, it's useful to know how your shoppers are paying for their purchases. For example, you may wish to know how many customers paid using Buy Now Pay Later (BNPL) payment methods. You may also wish to know how many paid with gift cards, or other forms of prepaid methods.
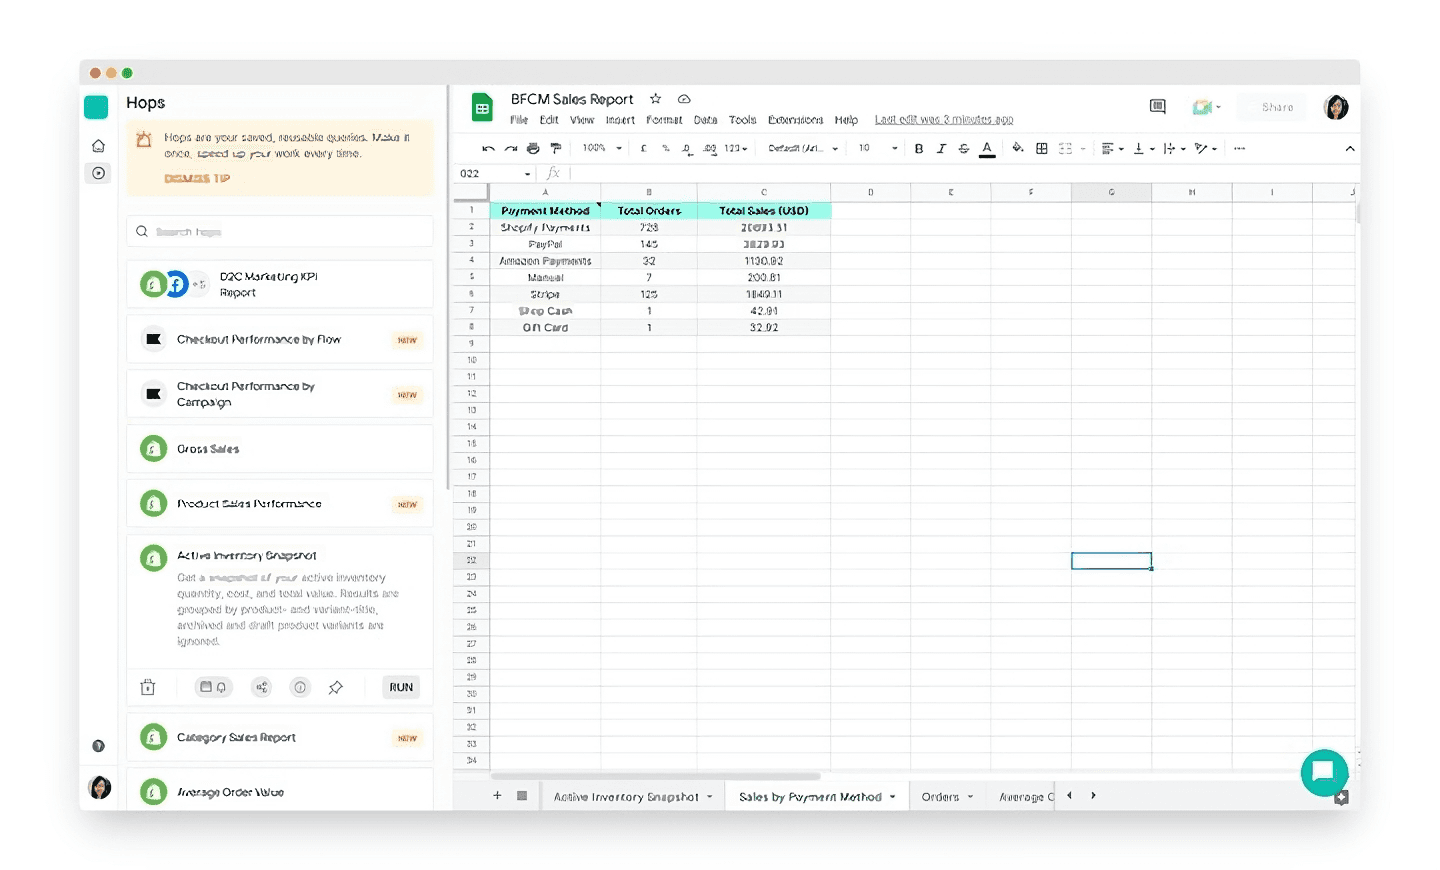
For this, use the Sales by Payment Method Hop. Below is a screenshot of how it looks:
Alternatively, you can also use the Gross Sales Hop with a filter by payment method. This will give you more data points if you need them.
Other quick queries
We know that's already plenty for you to go on, but we wanted to leave you with just a bit more value! Here are a few other Hops you can run to get a quick look at your store performance during the Black Friday shopping period:
Orders - Shows a daily rundown of orders, total sales, and products sold over the specified time period.
Coupon Code Performance - Shows a list of coupon codes and how frequently they have been used over the specified time period.
That's it from us! Hope this helps you get prepared for Black Friday sales, so you'll always have an organized view into your sales and product data, no matter how hectic it gets.
If you would like a video walkthrough of how to run these automations, check out this video from our cofounder, Saptarshi.
