Reporting & Analysis
13.09.2024
TLDR
Managing sales reports in multiple currencies is a common challenge for e-commerce businesses operating across different regions. By using Google Finance in Google Sheets, you can automate currency conversions and streamline your reporting process. Gather your sales data from platforms like Shopify or Amazon, and use Google Finance to apply real-time exchange rates for accurate currency conversion. Automating this workflow with Airboxr ensures that your reports are always up-to-date and with the correct exchange rates.
One of the challenges for founders and finance teams running an e-commerce business across different markets (e.g. USA, Canada, Australia, UK, Europe) is consolidating sales reports using multiple currencies, and converting them to a single currency for unified accounting purposes.
In addition, marketing teams may need to breakdown their revenues driven by different marketing campaigns, which may be reported in different currencies.
In this article, we’ll break down the steps needed for you to not only convert currencies in your reports within spreadsheets using the Google Finance function, we’ll also show you how to automate your reports so you never have to repeat this analysis again.
Under what circumstances would you need a currency converter for your store reports?
There are many scenarios in which it may become relevant for you to need a currency converter for Shopify reports, these can be:
If you run multiple Shopify stores or multiple Shopify instances of the same store in multiple currencies;
If you sell on multiple Amazon marketplaces that handle multiple currencies;
If you have physical stores in different countries that are handled by a POS system that sends sales reports back into a unified database;
All of the above.
How do you ensure the currency conversion reflects prevailing exchange rates?
An excellent way to ensure accurate currency conversion is to use Google Finance in your spreadsheet. Google Finance provides real-time exchange rates that can be integrated into your spreadsheet using the GOOGLEFINANCE function. This enables you to automatically update currency conversions using the date the sales were made, accounting for any difference in exchange rates over time. This approach ensures that your sales and finance reports always reflect the most accurate exchange rates without manual updates.
How do you create sales and finance reports adjusted to the right currency?
If you use either Shopify or Amazon as your e-commerce platform, the solution of currency conversion isn’t natively available. Shopify and Amazon don’t provide built-in options for automatic currency conversion in their reporting features. This limitation means that store owners must manually convert their sales data or rely on external solutions. Without these third-party tools, it’s challenging to get accurate financial insights in your preferred currency, making it harder to manage international sales effectively.
How do you create marketing reports adjusted to the right currency?
For Google Analytics and Klaviyo, there’s an option to change the currency in your reporting in your account setting but this only changes the symbol shown in the reports and not the actual values presented. This brings you back to the same helpful solution of exporting the reports and converting the currencies in a spreadsheet.
What are the steps needed to ensure currency conversion in automatically updating reports?
The first major hurdle is in figuring out the currency conversion; but once you’ve figured that out, there is the other major challenge of having to do the work over and over again, every time you need a report to be made.
It is crucial to convert sales data to the required currency to ensure accuracy and avoid discrepancies in financial reporting.
The truth is this process is quite boring and can get very repetitive easily but with the help of Airboxr and some spreadsheet formula magic, you can create a workflow to automatically convert the currencies for your reporting needs, saving both time and money. Here’s how:
Step 1: Run a Hop
Airboxr is a data automation platform that specializes in improving workflows for DTC brands by powering your reporting across your data sources within Google Sheets. Supported data sources include Shopify, Amazon, Meta Ads, TikTok Ads, Google Ads, GA4, and Klaviyo.
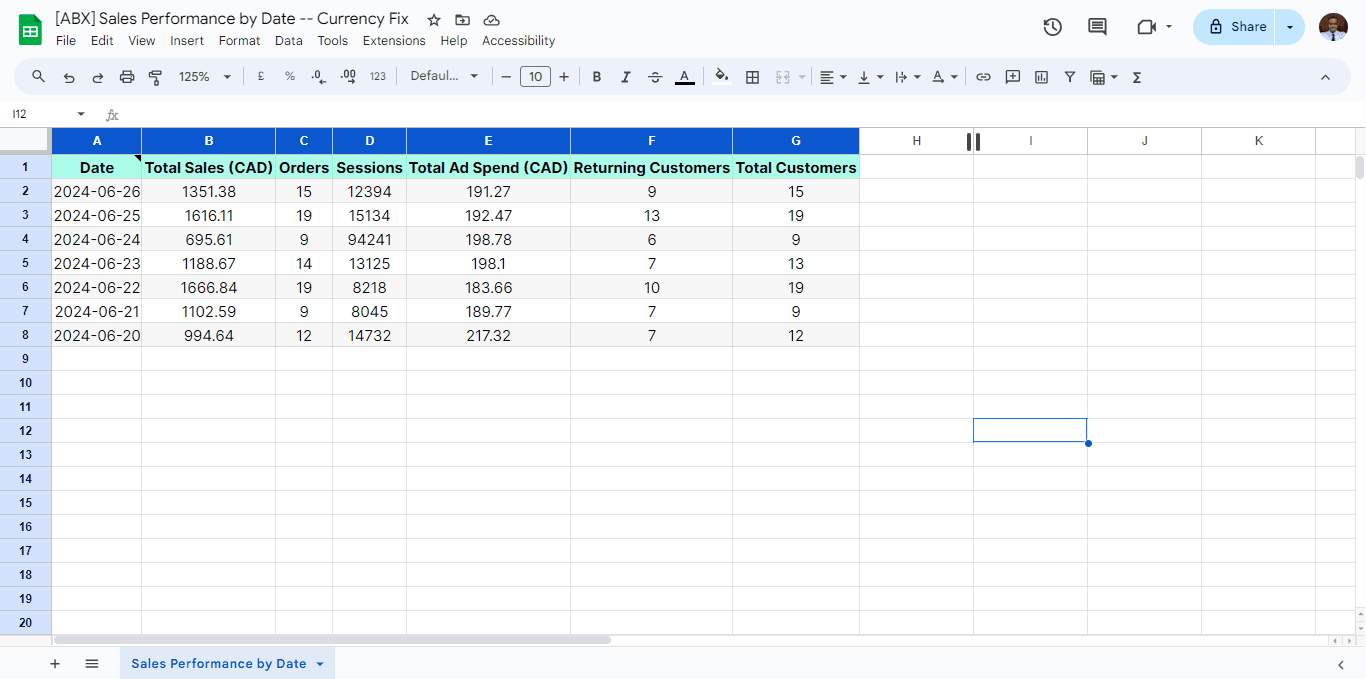
For the sake of this tutorial, we shall be using a hop (an automated report) called Sales Performance by Date. This report pulls from your Shopify, connected ad accounts, and GA4 to present these metrics on a daily basis:
Total Sales (Shopify)
Orders (Shopify)
Sessions (GA4)
Total Ad Spend (Connected ad accounts)
Returning Customers (Shopify)
Total Customers (Shopify)
Using Airboxr saves you the stress of having to download, clean and summarize data from to create individually.
The scenario in this case is that we want to convert our CAD sales/spend numbers here to USD for final reporting.
Step 2
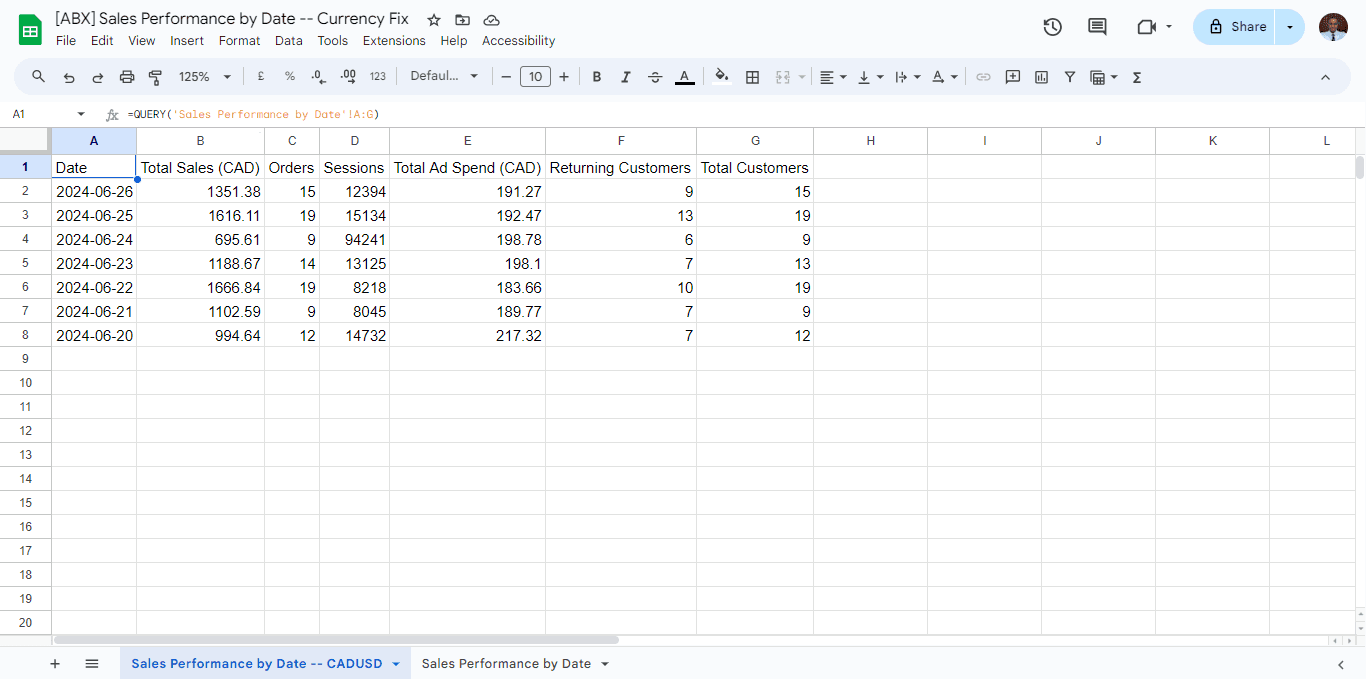
Now that you have your report in your spreadsheet, let’s begin. We will create a new sheet in this spreadsheet titled “Sales Performance by Date -- CADUSD”. In cell A1, we would use the QUERY formula to create a copy of the Sales Performance by Date report. The formula we would use here is: =QUERY('Sales Performance by Date'!A:G)
Step 3
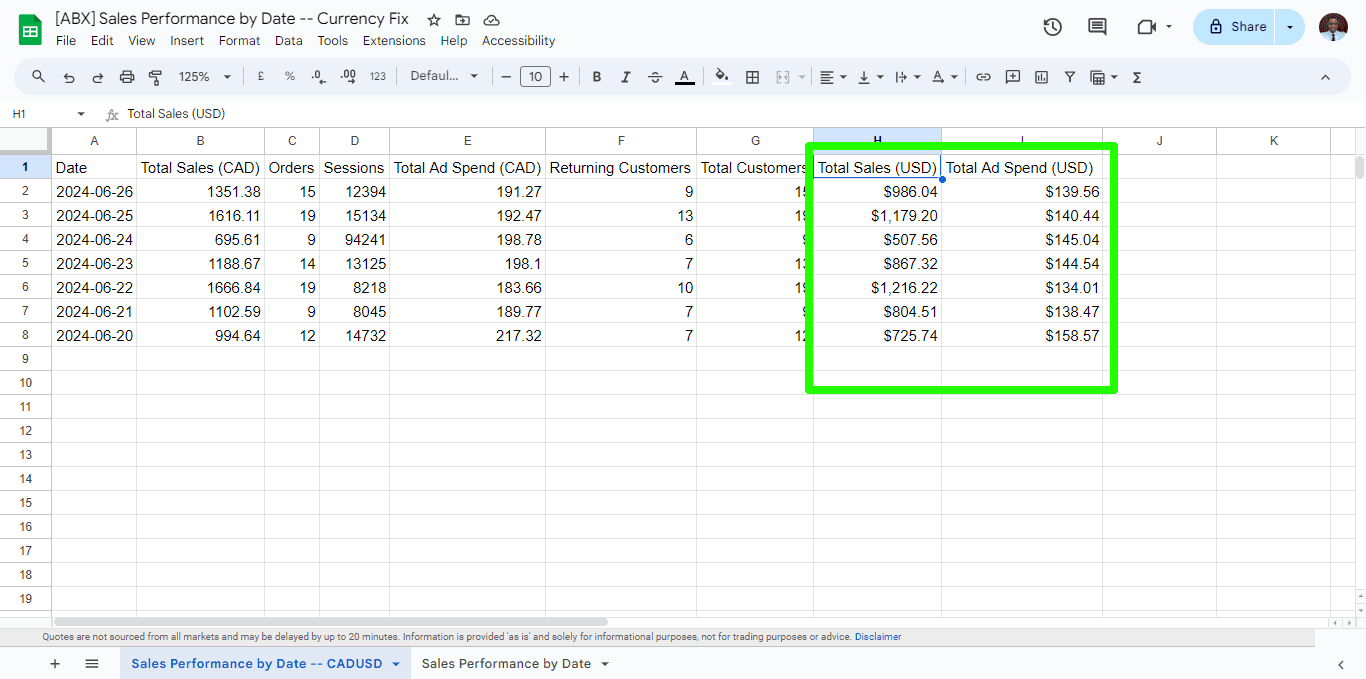
In our new sheet, we will need to create 2 new columns; Total Sales (USD) and Total Ad Spend (USD) in columns H and I. We would convert the CAD metrics to USD in these columns. To do this we would be using a combination of IF, ARRAYFORMULA, GOOGLEFINANCE and DATE functions.
In cell H2, input:
=ARRAYFORMULA( IF(A2:A=””, “”, B2:B*INDEX(GOOGLEFINANCE(“CURRENCY:CADUSD”,”price”,TO_DATE(A2:A)), 2, 2)))
In cell I2, input:
=ARRAYFORMULA(IF(A2:A=””, “”, E2:E*INDEX(GOOGLEFINANCE(“CURRENCY:CADUSD”,”price”,TO_DATE(A2:A)), 2, 2)))
Your sheet should look like this now:
Improve your DTC game. Sign up for weekly tips.
These formulas pull the exchange rate from Google Finance for each day using the date column (column A) and then multiply it by the sales and spending figures in columns B and E respectively.
With this, you can go a step further by calculating your AOV in column J by using this formula: =ARRAYFORMULA(IF(A2:A=””, “”, H2:H/C2:C))
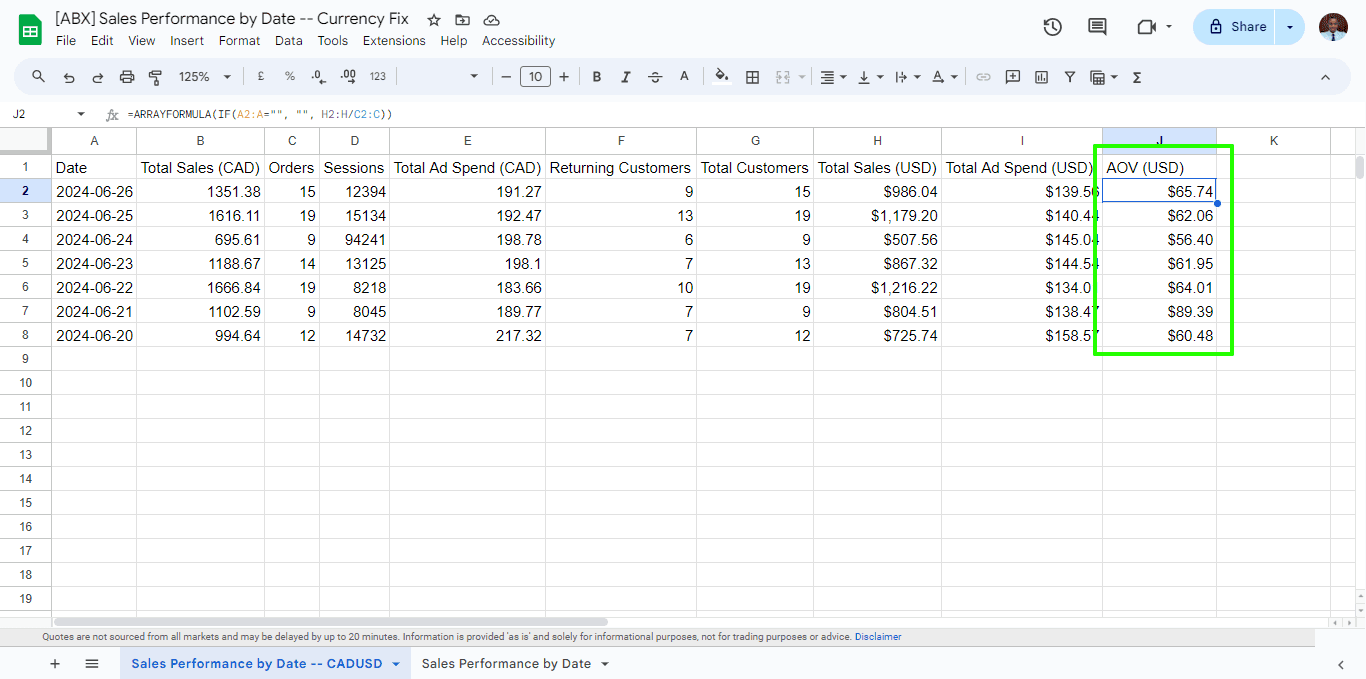
Now that you have your store’s total sales, total ad spend, and AOV all in USD, you can easily compare prices and budget more effectively. You can schedule the Sales Performance by Date report to update daily (or any interval of your choice) using the schedule hop option. Here’s a video walkthrough of how you can schedule reports:
If you need any further assistance on how to automate this report or you already have an internal report that needs automating, feel free to text us in our in-app chat and we’ll connect you with a representative of ours.
